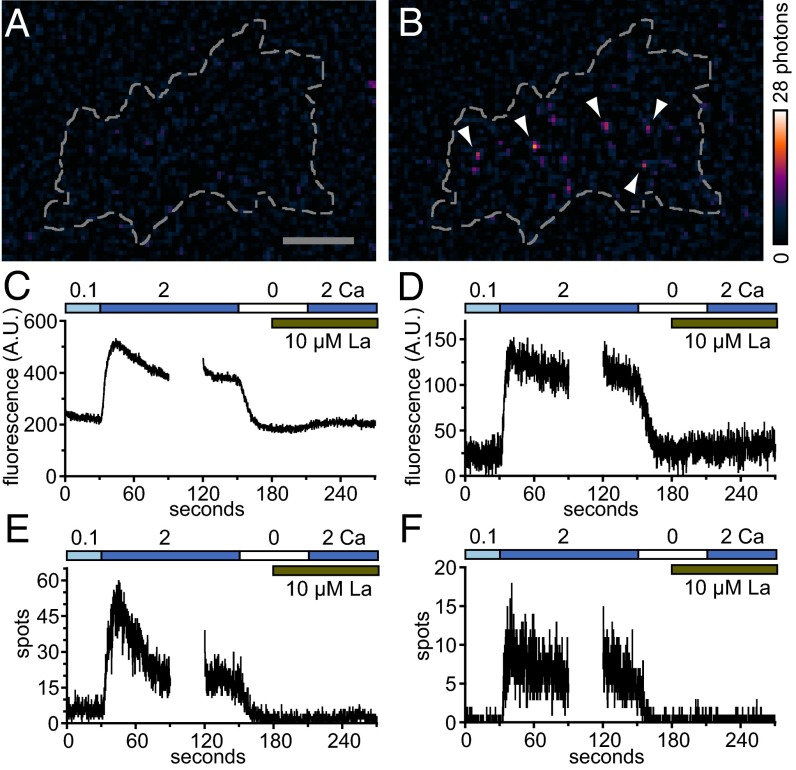
Fig. 3.
Discrete G–GECO1.2–Orai1 fluorescence transients activated by high-level CAD expression exhibit physiological characteristics of Orai1 channels. (A and B) TIRF images of a HEK 293A cell cotransfected with low levels of G–GECO1.2–Orai1 Y80E and high levels of CAD in 0.1 Ca (A) and 2 s later after shift to 2 Ca (B). Arrowheads indicate selected fluorescence transients present at the basal surface of the cell (indicated by the dashed line). (Scale bar, 5 µm.) (C and D) Time courses of mean green fluorescence (arbitrary units, A.U.) of the cell basal surface of HEK 293A cells transiently cotransfected with either wild-type Orai1 (C) or Y80E (D) G–GECO1.2–Orai1 and high levels of CAD. (E and F) Time course of the number of fluorescent spots identified from the cell basal surface of HEK 293A cells transiently cotransfected with either WT (E) or Y80E (F) G–GECO1.2–Orai1 and high levels of CAD. C and E and D and F are individual cell responses representative of n = 3 and n = 5 cells, respectively.

