Fig. 5.
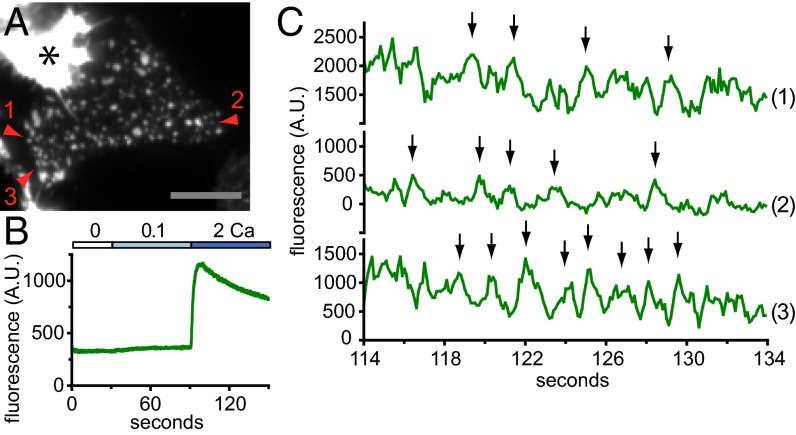
Single-channel activity in Orai1 puncta. (A) Green channel TIRF image of a HEK 293A cell cotransfected with G–GECO1.2–Orai1 and STIM1 after treatment with 2 µM TG. Average of 200 consecutive frames taken for the time period plotted in C. Red arrowheads indicate puncta plotted in C. (Scale bar, 10 µM.) Asterisk indicates a brightly fluorescent adjacent cell. (B) Time course of mean G–GECO1.2–Orai1 fluorescence of the cell footprint (in arbitrary units, A.U.) imaged at 10 frames per second. (C) Single-pixel intensity records of G–GECO1.2–Orai1 at the center of a punctum (1), at the edge of a dim punctum (2), and in a punctum that exhibits periodic fluorescence intensity fluctuations (3). Arrows indicate characteristic peaks repeated in each trace. Time corresponds to the plot in B. Traces are four-frame moving averages. Responses taken from one of n = 3 cells.

