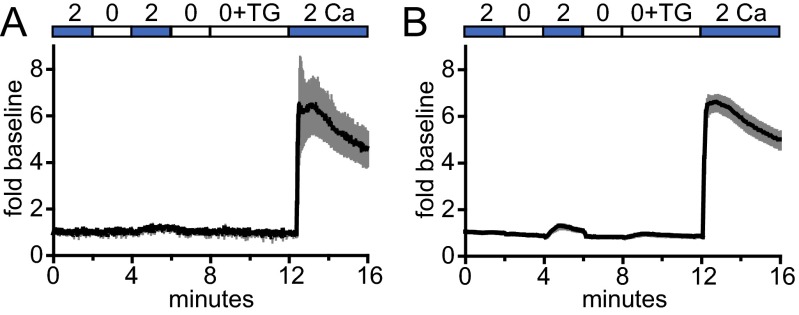
Fig. S2.
Different configurations of GECI–Orai1 detect Ca2+ influx in transfected cells. Time courses of G–GECO1.2–Orai1 (A; n = 5 cells) and Orai1–GCaMP6f (B; n = 14 cells) plotted as mean fold baseline versus time (black lines) in HEK 293 cells transiently cotransfected with STIM1 and treated with 2 µM TG. Gray bars indicate ± SEM.

