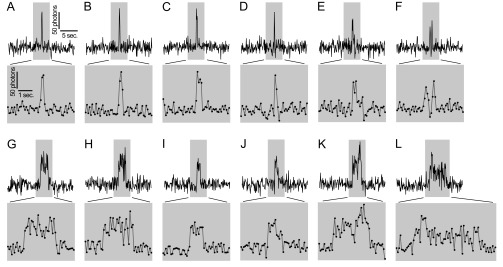
Fig. S4.
Representative optical single channel Orai1 traces. (A–L) G–GECO1–Orai1 traces from HEK 293A cells cotransfected with low levels of mCherry–CAD and TIRF imaged in 2 Ca. Excerpts of 20-s are shown in the Top rows for traces containing flickers (A–F) and pulses (G–L). Regions highlighted in gray correspond to expanded 5-s excerpts are shown below. Note that D and G correspond to the traces shown in Fig. 2 D and E, respectively, but with higher temporal resolution.

