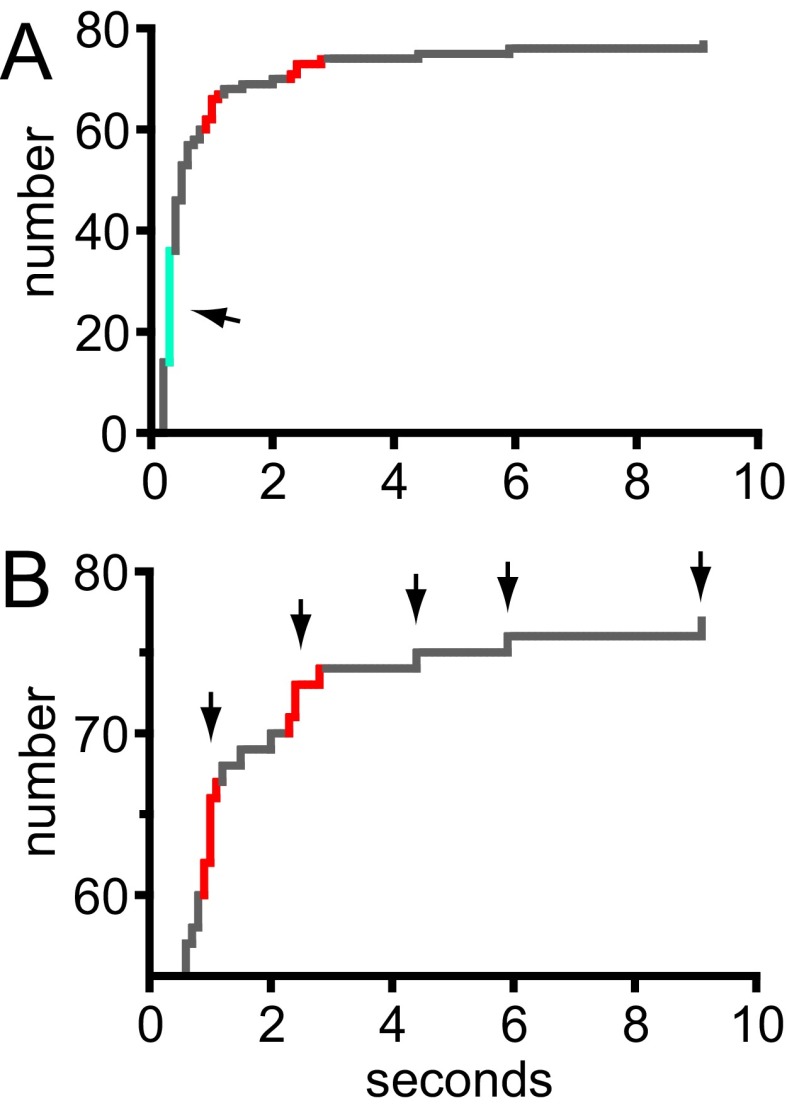
Fig. S5.
Two classes of low-CAD G–GECO1–Orai1 transients. (A) The duration of G–GECO1–Orai1 fluorescence transients plotted as a cumulative distribution. The center of flicker durations is shown in turquoise (also indicated by arrow) and the centers of clusters of pulse durations are shown in red. (B) Expanded view of the cumulative distribution plotted in A. Black arrows indicate clusters of pulse durations and durations of longer individual pulses. Pulse durations appeared to occur at an interval of ∼1.5 s, starting at ∼1 s.

