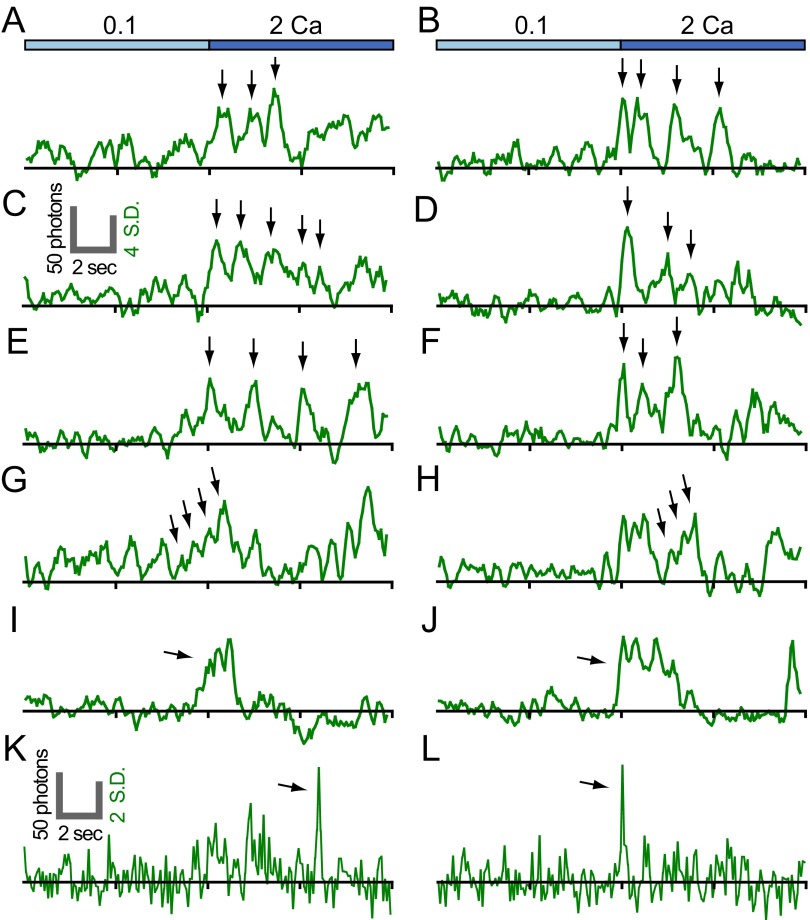
Fig. S7.
Fluctuations in single-channel optical recordings from high-CAD cells. Example traces of G–GECO1.2–Orai1 WT (A, C, E, G, I, and K) and GECO1.2–Orai1 Y80E (B, D, F, H, J, and L) upon shift from 0.1 to 2 Ca. Arrows in A–F indicate fluctuations in the fluorescence traces. Arrows in G and H indicate progressive increases in fluorescence intensity consistent with progressive activation of G–GECO1.2–Orai1 subunits of a single channel. Arrows in I and J indicate discrete pulses and in K and L, discrete flickers. The right vertical scale bar indicates 4 SD (C; applies to A–J) and 2 SD (K; applies to K and L) above the mean cell basal surface fluorescence. (A–J) Four-frame moving averages. (K and L) Raw with background subtraction. Traces are aligned by the initial rise in fluorescence after shift to 2 Ca.

