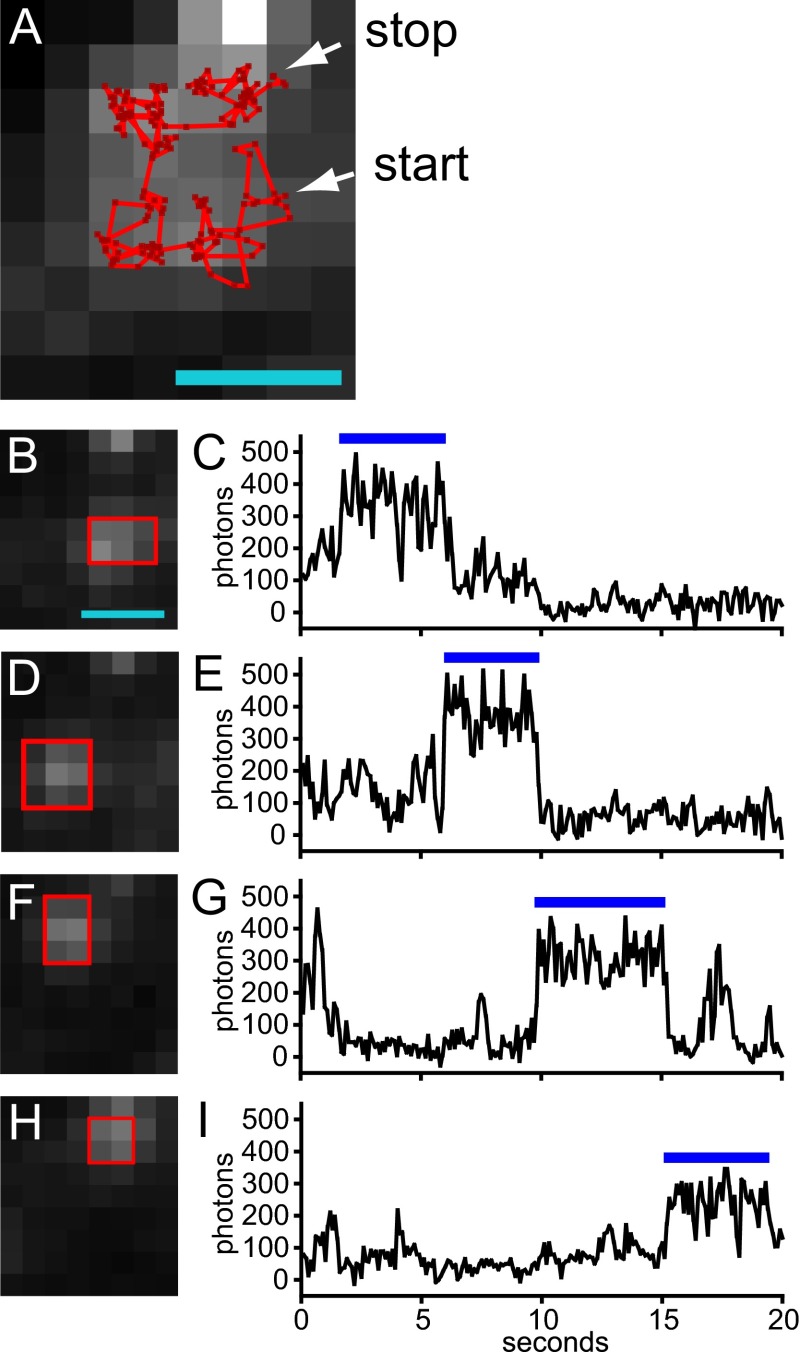
Fig. S8.
Some EGFP–Orai1 channels exhibit restricted diffusion in the presence of CAD. EGFP–Orai1 and mCherry–CAD were cotransfected into HEK 293A cells and imaged using TIRF microscopy. (A) Single-particle track of a single EGFP–Orai1 channel imaged at 10 frames per second. Channel positions are indicated by dark red points, and trajectories between points are indicated by bright red lines. Starting and stopping points are indicated by white arrows. The average of 200 consecutive frames of green fluorescence is shown in grayscale. Note that the single channel visits four adjacent regions during the imaging period. (B–I) Average green fluorescence images of the channel from A in particular regions (B, D, F, and H) and plots of fluorescence intensity for these regions (C, E, G, and I). The blue bars above the plots indicate the time of residence for the channel, and green fluorescence images were averaged over this period. The ROIs indicated by the red boxes were used for measuring channel intensity. Note that the time of residence for each region is ∼4–6 s and channel intensity does not fluctuate appreciably during these intervals. (Scale bar for A and B, 1 µm; applies also to D, F, and H.) A total of 34 of 111 channels from three cells exhibited diffusion within restricted domains. Note that hindered diffusion of Orai1 channels has been previously noted in Wu et al. (42) and CAD coexpression with Orai1 decreases the rate of diffusion (8).

