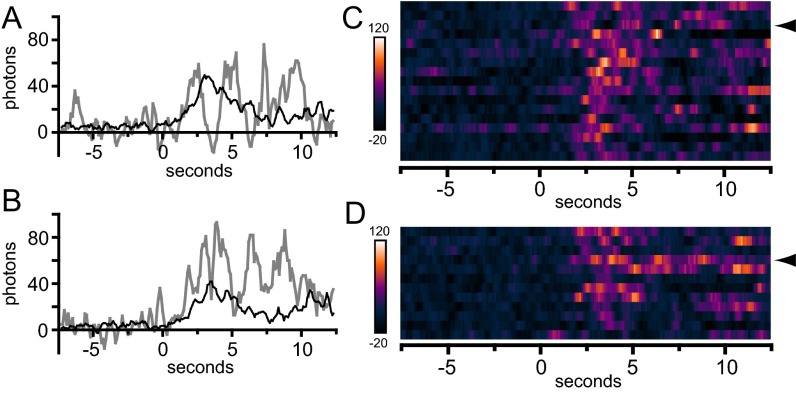
Fig. S9.
Temporal distribution of high-CAD G–GECO1.2–Orai1 transients. A and C are taken from a representative G–GECO1.2–Orai1 WT transfected cell, and B and D are taken from a G–GECO1.2–Orai1 Y80 transfected cell. (A and B) Graphs comparing a single trace containing pulses (gray lines) with the average of the remaining traces (black lines) identified in the first 2 (A) or 3 (B) seconds of response after shift from 0.1 to 2 Ca, indicated at time = 0 s. (C and D) Traces visualized by mapping intensity using pseudocoloring. Traces from n = 17 (C) and n = 12 (D) separate pulses are represented as rows of elongated pixels. Each pixel corresponds to the intensity from a single 100-ms frame after application of a four-frame moving average. Time = 0 s indicated the initiation of shift from 0.1 to 2 Ca. Arrowheads in C and D indicate the rows corresponding to the individual traces plotted in A and B, respectively.

