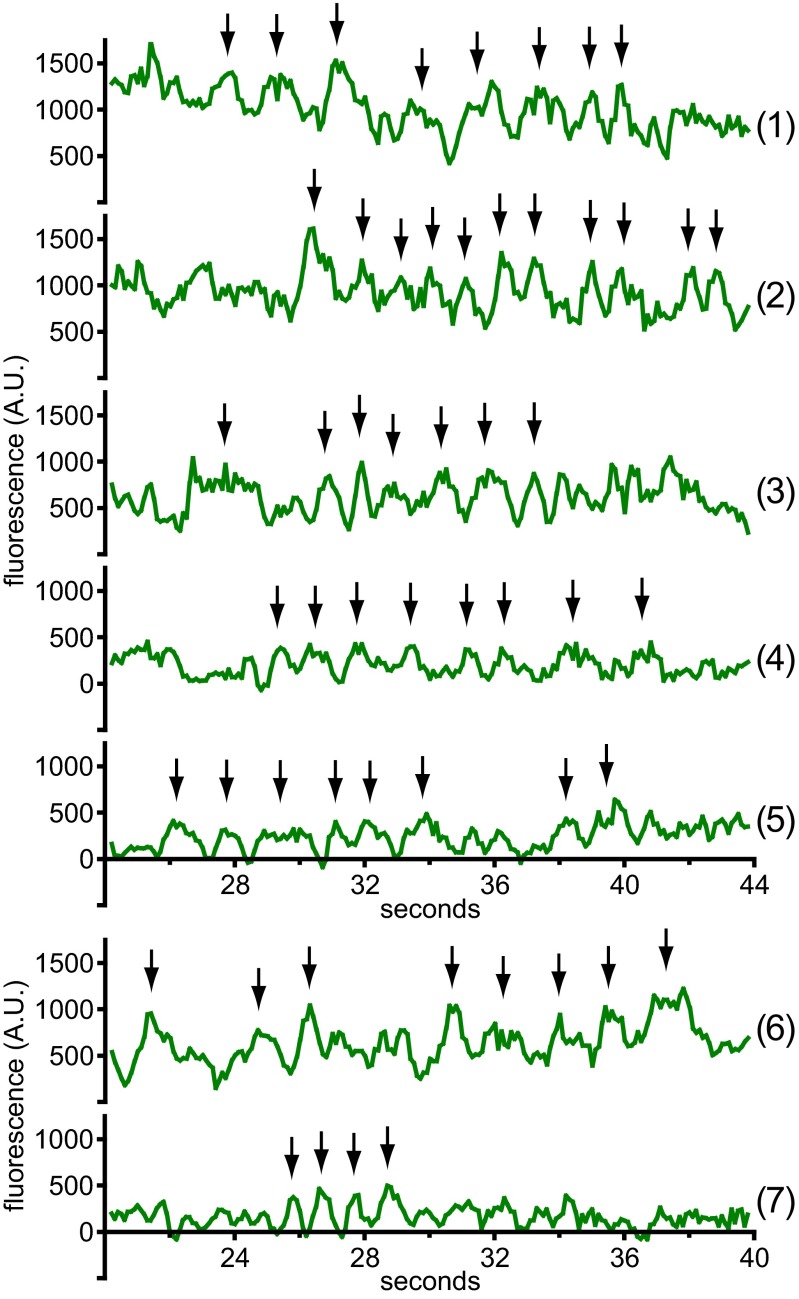
Fig. S10.
Single-channel activity in Orai1 puncta. Single-pixel intensity records from two cells coexpressing STIM1 and G–GECO1.2–Orai1 WT (traces 1–5) and G–GECO1.2–Orai1 Y80E (traces 6 and 7) after shift from low to high Ca. Traces 1–3, and 6 correspond to intensity fluctuations above baseline, consistent with multiple channels per recording, and traces 4, 5, and 7 correspond to intensity fluctuations that arise from baseline, consistent with a single channel per recording. Arrows indicate successive peaks. Time corresponds to the number of seconds after shift from 0.1 Ca to 2 Ca (traces 1–5) or 1 Ca (traces 6 and 7). Traces are four-frame moving averages.

