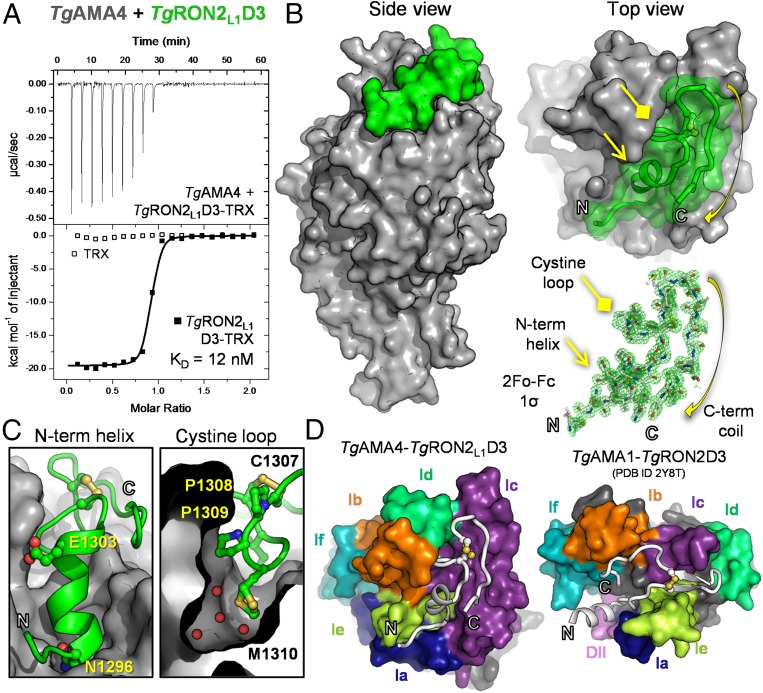
Fig. 3.
Biophysical and structural characterization of the TgAMA4–TgRON2L1D3 complex reveals a divergent binding paradigm. (A) ITC thermogram of TgRON2L1D3-TRX or TRX titrated into TgAMA4. (B) Side (Left) and apical (Upper Right) views of the TgAMA4–TgRON2L1D3 complex, with the overall surface of TgAMA4 colored gray and TgRON2L1D3 colored green. (Lower Right) Sigma-A weighted 2Fo − Fc electron density map contoured at 1.0 σ for TgRON2L1D3. (C) Zoomed in view of the N-terminal helix (Left) and cystine loop (Right; red spheres indicate water molecules) packing against the surface of TgAMA4 (gray). Residues investigated by mutagenesis are labeled and shown in ball-and-stick form. (D) Apical view of surface representations of the TgAMA4–TgRON2L1D3 and TgAMA1–TgRON2D3 (PDB ID code 2Y8T) complexes oriented with the conserved AMA DI-DII cores aligned and the TgAMA apical DI loops colored individually (navy blue, Ia; orange, Ib; purple, Ic; lime green, Id; yellow-green, Ie; teal, If) and the DII loop colored pink.

