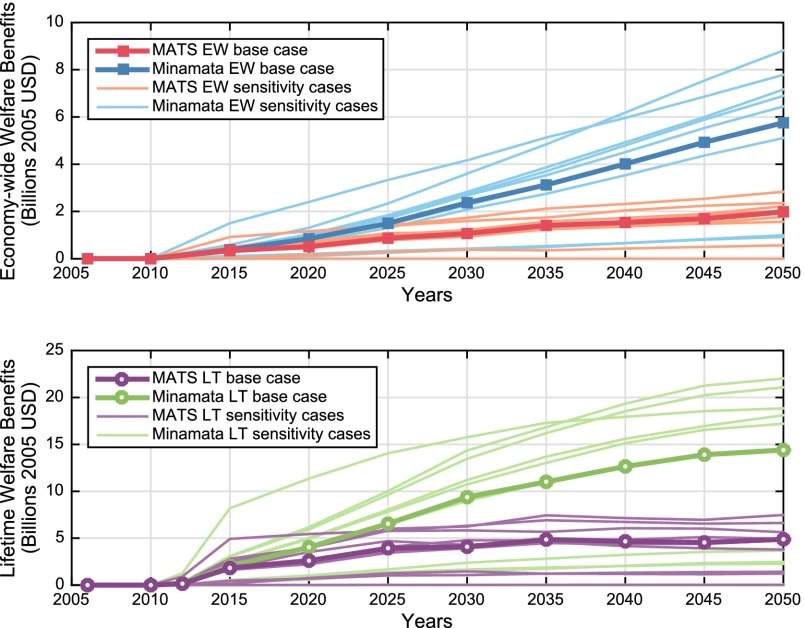
Fig. 2.
Trajectories of welfare benefits under global and domestic policy until 2050, discounted at 3%. (Top) Modeled EW benefits realized in a given year. (Bottom) Projected LT benefits for that year’s affected population. Base cases are indicated with markers. Unmarked lines show the range of trajectories from sensitivity cases.

