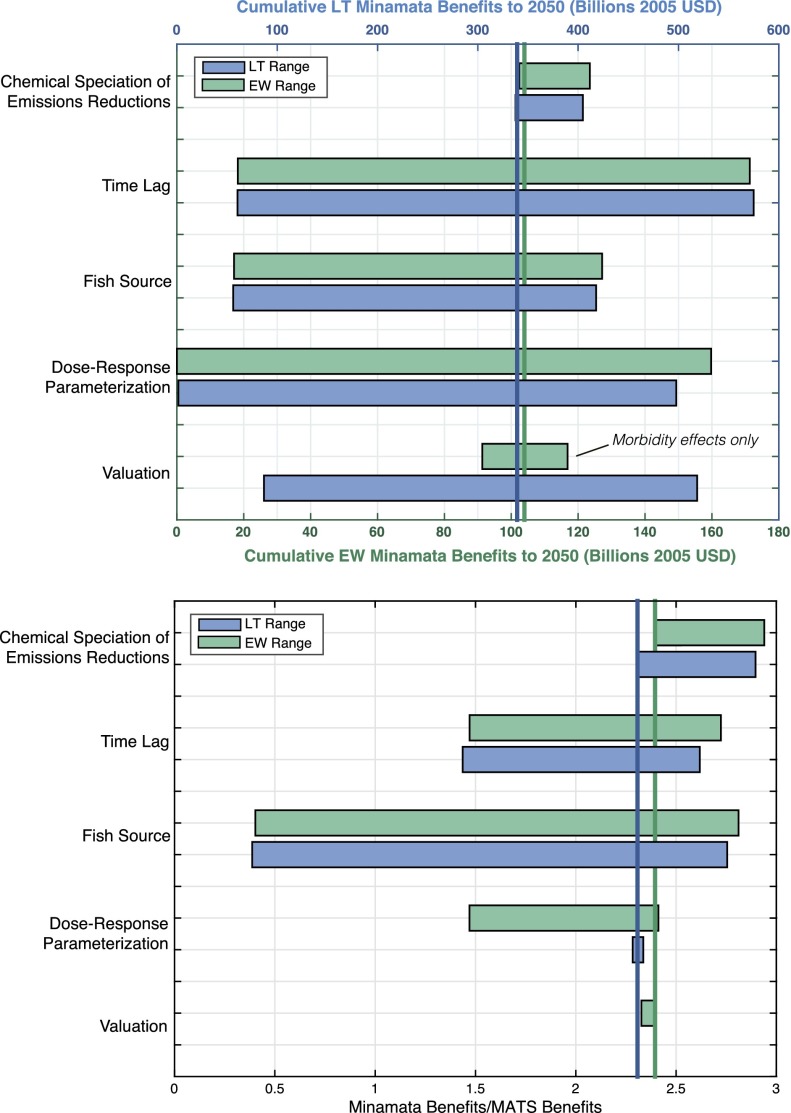
Fig. 3.
(Top) Range in cumulative benefits of the Minamata scenario to 2050. Note the different scales for LT and EW benefits. (Bottom) Range in ratio of cumulative benefits to 2050 (Minamata Benefits/MATS Benefits). Blue and green lines show base case results for LT and EW benefits, respectively. Bars indicate the sensitivity of cumulative benefits to high and low case assumptions for uncertain parameters.

