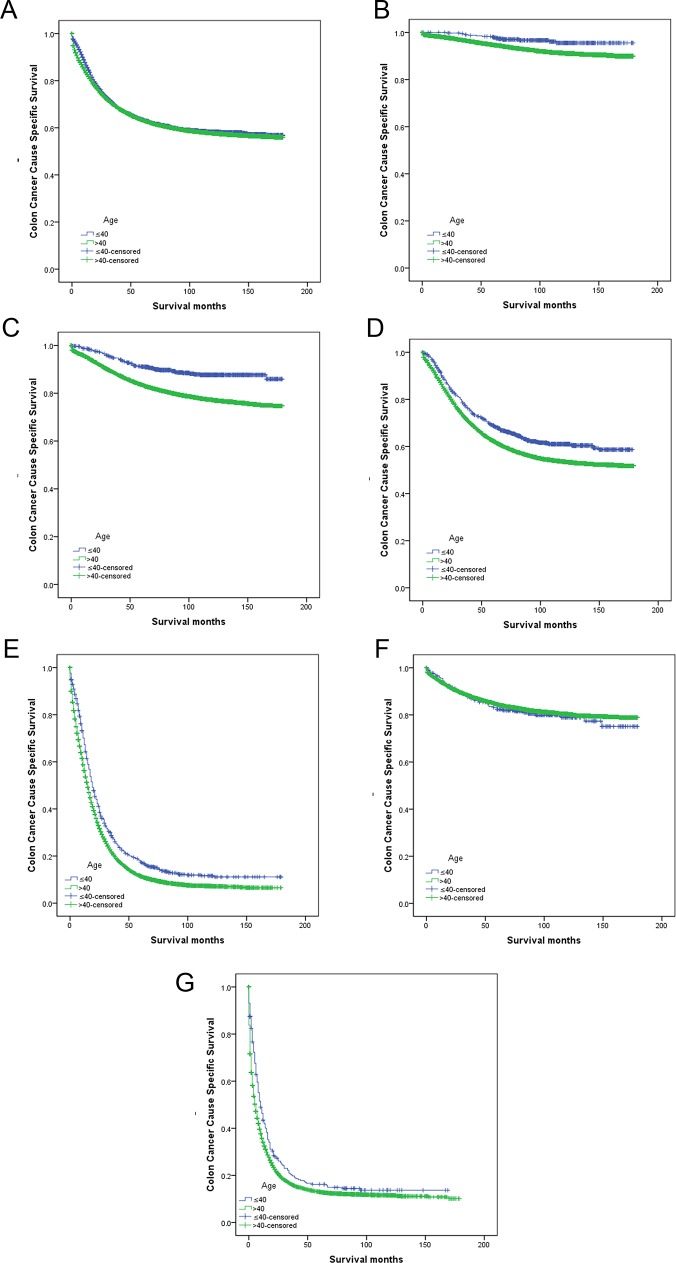
Fig 1. Survival curves for colon cancer patients at younger (≤ 40 years) and older (> 40 years) group.
(A) All patients treated with surgery, χ2 = 0.033, P = 0.86. (B) Stage I colon cancer treated with surgery, χ2 = 10.368, P<0.001. (C) Stage II colon cancer treated with surgery, χ2 = 56.935, P<0.001; (D) Stage III colon cancer treated with surgery, χ2 = 27.752, P<0.001. (E) Stage IV colon cancer treated with surgery, χ2 = 45.775, P<0.001. (F) Unknown stage patients treated with surgery, χ2 = 0.410, P = 0.52. (G) Patients with colon cancer treated without surgery, χ2 = 12.760, P<0.001.

