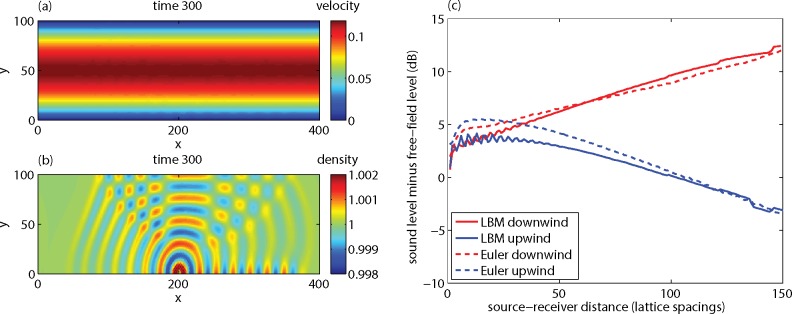
Fig 17. LBM results for a system with a sound source in a Poiseuille flow profile.
Figure (a) shows the horizontal velocity component. Figure (b) shows the density field. Figure (c) shows the excess sound level ΔL at receivers near the lower wall (at the same height as the source, i.e. two lattice spacings above the lower wall).

