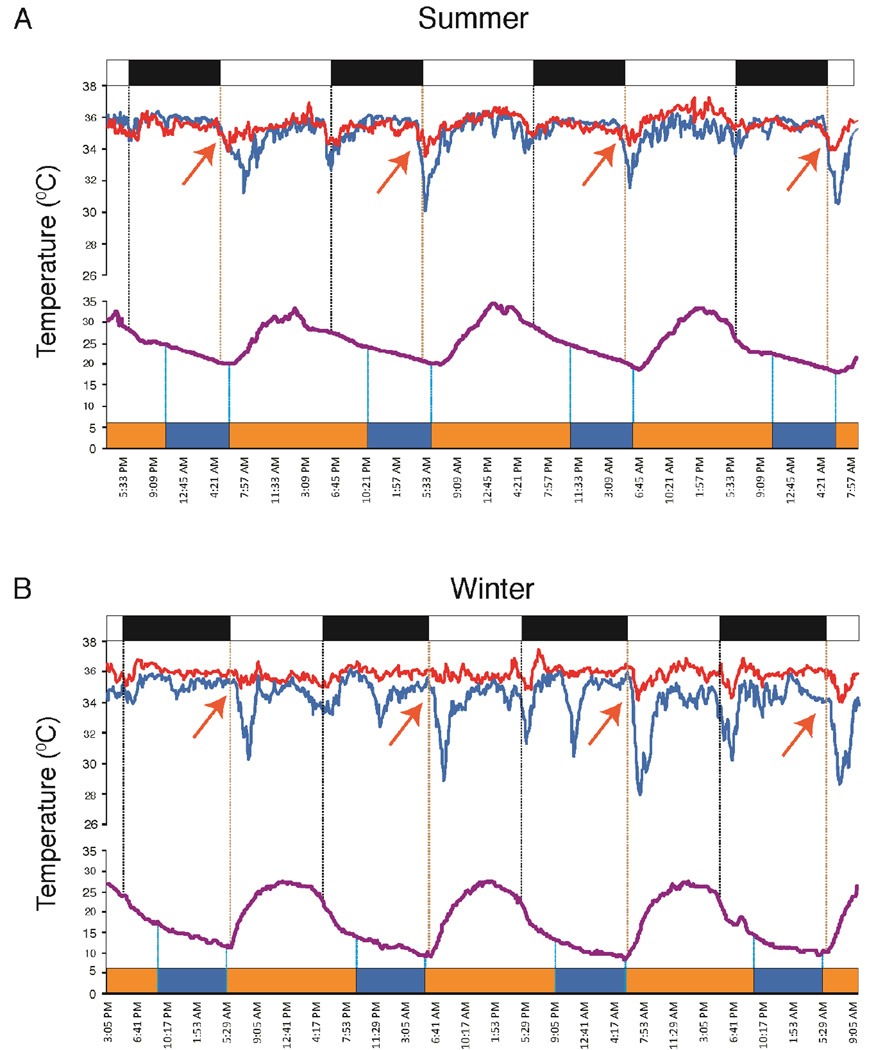
Fig. 4. Relation of sleep to ambient temperature and skin temperature.
Sleep offset, averaged across all subjects and all days, consistently occurs near the nadir of daily environmental temperature, in both summer and winter. In the San recorded in the summer, the temperature nadir occurred after sunrise, as did awakening. In the winter the nadir occurred near sunrise with awakening preceding sunrise. Note that the ambient temperature has a gradual fall at night and a rapid rise starting at sunrise, with sleep occurring during the period of slowly falling temperature. Vasoconstriction is seen upon awakening in both summer and winter. In the winter there are additional vasoconstrictions occurring during the day. These are likely related to food preparation or other similar activities exposing the hands to cold. Violet lines are environmental temperature, red line, abdominal temperature, blue line, finger temperature. Also see Fig. S2 for an example of individual subject data. All temperatures recorded by iButtons are synchronized to the actiwatch time ±2 min. Black bar=night, orange=waking, blue=sleep. Vertical lines at top of figures indicate light-dark transitions; those at bottom indicate sleep-wake transitions. Sleep measures are averages of 15 participants recorded in the summer and 13 of these participants recorded in winter (See Fig. 1, Table S1). Red arrows indicate onset of drop in finger temperature starting near the temperature nadir, indicative of peripheral vasoconstriction, serving to warm proximal regions with awakening.

