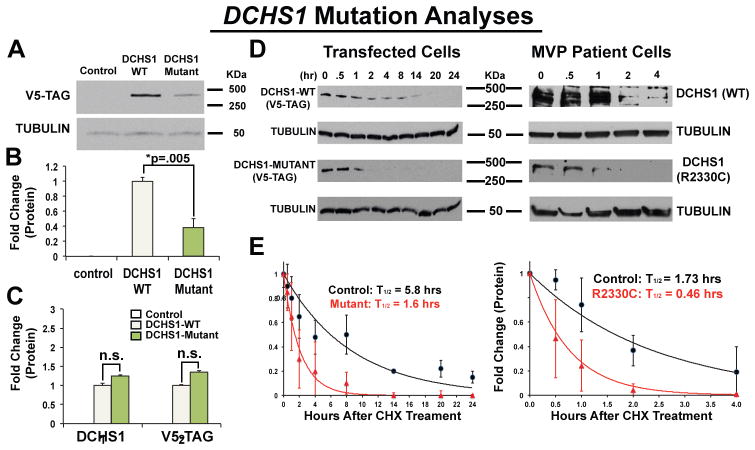
Figure 3. DCHS1 Mutations Result In Diminished Protein Levels.
(A–C) Western blot: (p.P197L/p.R2513H) mutant DCHS1 results in a 60% decrease in protein with no change in RNA expression. (D) Left Panel: DCHS1 wild-type (WT) or mutant (p.P197L/p.R2513H) transfectants treated with cycloheximide for specified times followed by Western analyses. Right Panel: Cycloheximide on Control (DCHS1 WT) or MVP patient (p.R2330C) MVICs. Tubulin=loading control (E) Graphical depiction of calculated protein half-lives. WT and mutant transfectants half-life = 5.8 hours versus 1.6, respectively (left graph). Control and mutant DCHS1 half-life is 1.73 hours versus 0.46 hours, respectively (right graph). Analyses performed in triplicate and repeated four times. Error bars = standard deviations; p-values calculated using two-tailed Students t-test.

