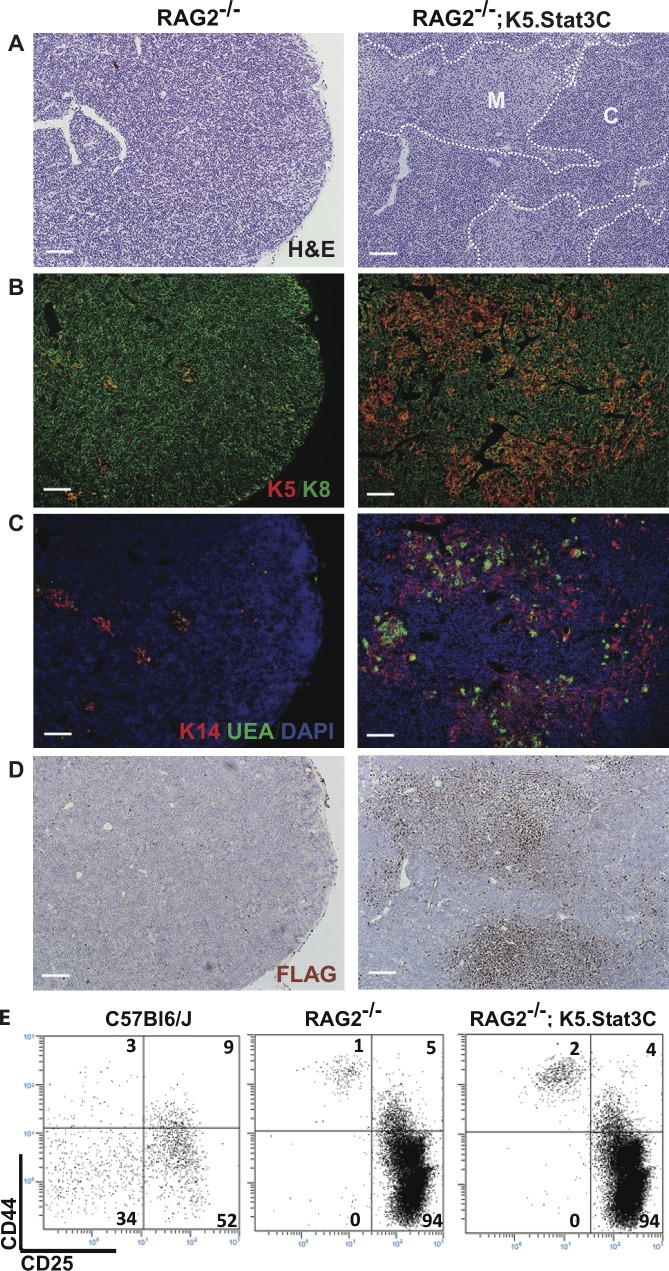
Fig 2. K5.Stat3C expression generates medullary regions in RAG-2-/- thymi.
(a-d) Serial frozen sections of RAG-2-/- and RAG-2-/-;K5.Stat3C thymi. (A) H&E stain shows medullary region expansion in RAG-2-/-;K5.Stat3C thymi. The dotted line separates cortex (C) and medulla (M). (b-d) IHC staining showing expression of (B) K5 and K8; (C) K14, UEA-1 and DAPI; (D) Flag epitope. Data are representative of at least 5 mice of each genotype. (E) FACS analysis of CD4-CD8- thymocyte subsets identified, by CD25 and CD44 expression, from wildtype, RAG-2-/- and RAG-2-/-;K5.Stat3C mice. The percentage of cells in each subset is shown on the FACS plots. FACS data are representative of 3 mice from each genotype. Scale bar: 200μm.

