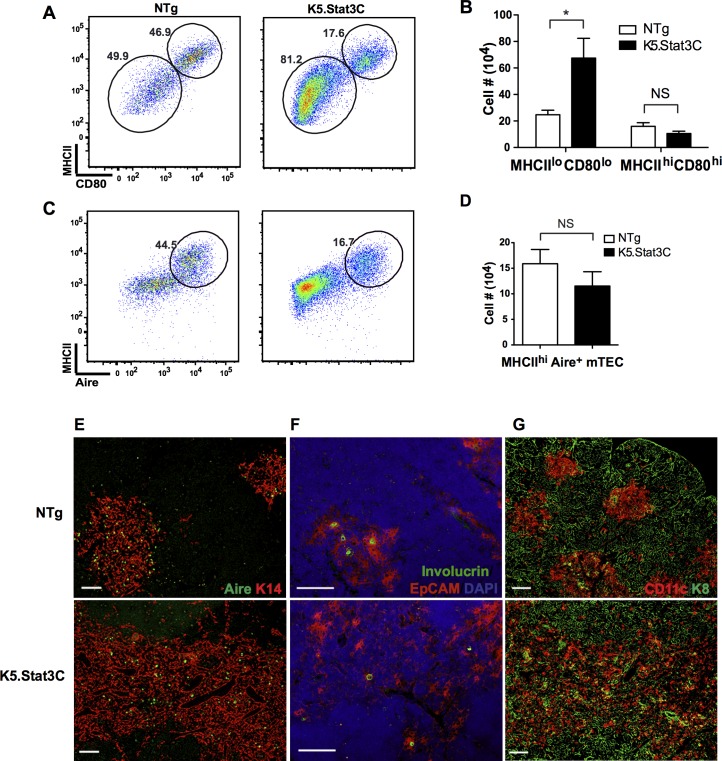
Fig 4. MHCIIloCD80lo mTECs are selectively expanded in K5.Stat3C transgenic thymi.
(A) Representative FACS plots show percentage of MHCIIloCD80lo and MHCIIhiCD80hi mTECs. (B) Bar graph shows number (mean ± SD) of MHCIIlo and MHCIIhi mTECs in K5.Stat3C and control thymi (n = 5 each). (C) FACS plots show percentage of MHCIIhiAire+ mTECs. (D) Bar graph shows number (mean ± SD) of MHCIIhiAire+ mTECs (n = 5). (E) IHC stains show abundant K14+ and Aire+ mTECs in K5.Stat3C thymi. Scale bar: 200μm. (F) The frequency of involucrin+ mTECs is not increased in K5.Stat3C thymi. Scale bar: 100μm. (G) IHC stains show K8 expressing cTECs and CD11c expressing DCs. Scale bar: 200μm. *P<0.05 (Student’s paired t-test).

