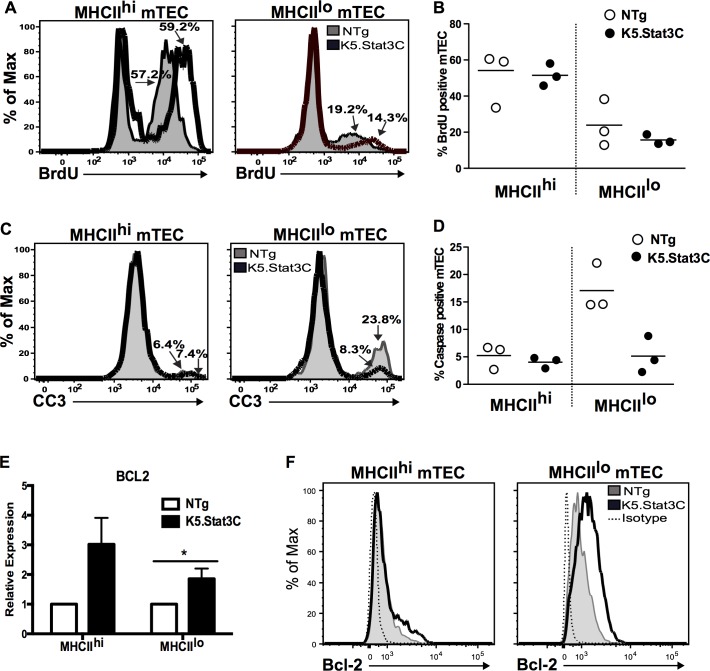
Fig 5. Expression of K5.Stat3C enhances MHCIIloCD80lo mTEC survival, but not proliferation.
(A) Representative FACS histograms showing frequency of BrdU positive cells in MHCIIhi and MHCIllo mTEC subsets from K5.Stat3C (thick black line) and control (shaded) thymi. (B) Scatter graphs showing percentage of BrdU positive cells. (C) Representative FACS histograms showing frequency of cleaved caspase 3 (CC3) positive cells in MHCIIhi and MHCIllo mTEC subsets from K5.Stat3C (thick black line) and control (shaded) thymi. (D) Scatter graphs showing percentage of CC3 positive cells. (E) Quantitative RT-PCR analysis of Bcl-2 expression in MHCIIhi and MHCIllo mTECs. Relative expression of bcl-2 mRNA was normalized using α-tubulin mRNA and the NTg MHCIlhi mTEC control was set at 1. Bar graph shows mean ± SEM of four independent experiments with duplicate or triplicate samples in each experiment. *P<0.05 (Student’s unpaired t-test). (F) Representative FACS histograms showing Bcl-2 expression in MHCIIhi and MHCIllo mTEC subsets from K5.Stat3C (thick black line) and control (shaded) thymi.

