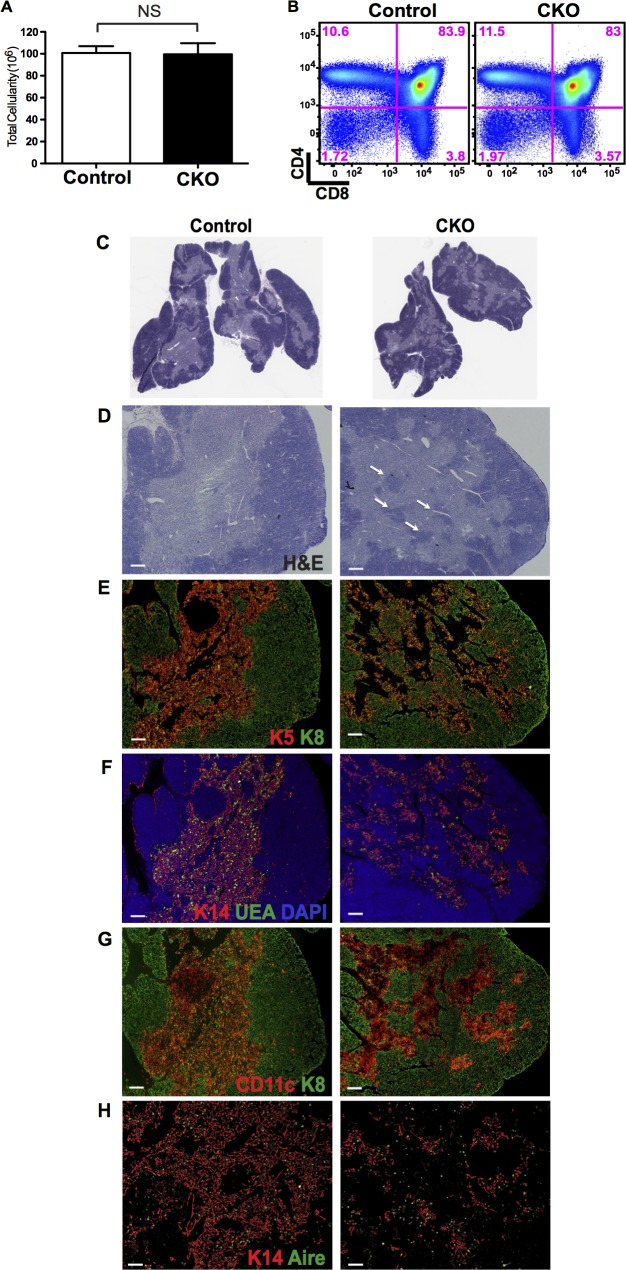
Fig 6. Depletion of Stat3 in the TEC compartment disrupts medullary architecture.
(A) Thymus cellularity is comparable in Stat3 CKO (n = 9 for both) and controls. (p = 0.9960, Unpaired Student’s T test) (B) FACS plots show comparable frequency of major thymocyte subsets defined by CD4 and CD8 expression. The percentage of cells in each quadrant is shown. Results are representative of 5 mice of each genotype. (C) Low power image of H&E stained frozen thymic sections. (D-H) IHC stains on frozen sections of CKO and control thymi (D) H&E (E) K5 and K8 (F) K14, UEA-1 and DAPI (G) CD11c and K8 (H) K14 and Aire. All images are serial sections with the exception of the control section in H. Results are representative of at least 5 thymi of each genotype. Scale bar: 200μm.

