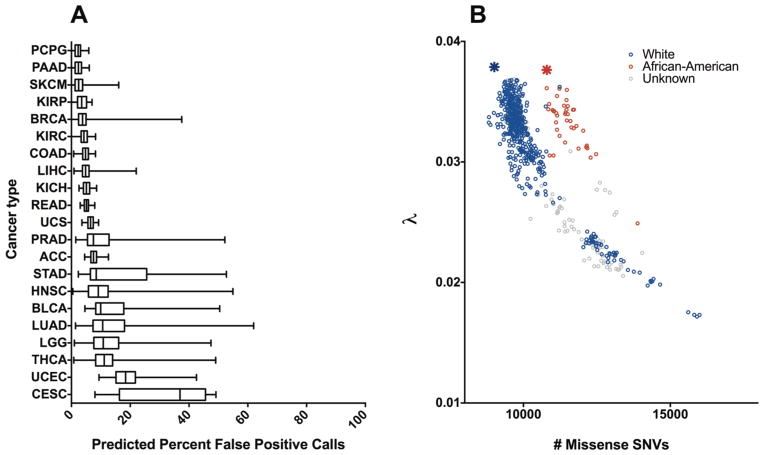
Fig. 3.
Application of λ to TCGA cohorts. (a) Predicted noise across 21 TCGA cancer types. The data are represented in a box-and-whiskers plot that uses the center line to indicate median, the box to indicate quartiles, and the whiskers to indicate range. Cancer types are ordered by median. (b) Exponential relationship between λ and number of missense SNVs in Lung Adenocarcinoma. Associated open-access clinical data provided by TCGA was used to separate patients by their self-identified race. The average lambda/number of missense mutations for the 1000 Genomes Project Caucasian (CEU) and African-American (ASW) cohorts are noted with a blue and red star, respectively.

