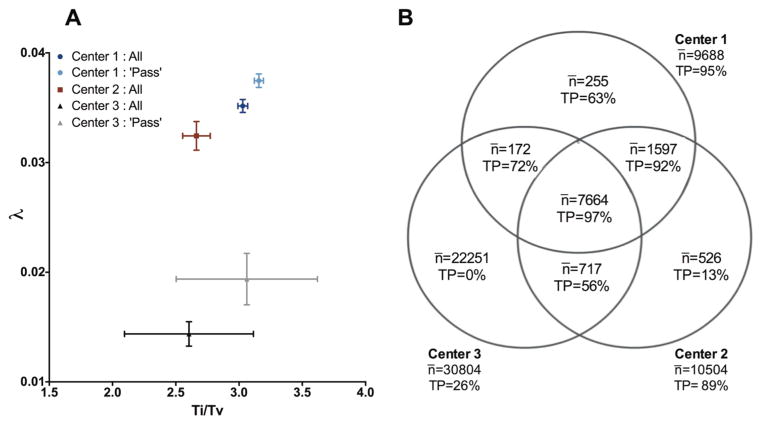
Fig. 4.
KICH SNV calls for three centers (a) λ and Ti/Tv of calls. For each patient assessed by each center, λ and Ti/Tv were calculated and the average and standard deviations of these values are displayed by institution. For centers 1 and 3, internal ‘pass’ filters were available and are displayed as well. (b) Predicted percentage of true calls for calls agreed upon by 1, 2, or 3 institutions. For 65 KICH patients assessed by all three centers, all calls regardless of internal filtering were separated by the institution(s) that identified them. The average number of missense mutations per patient, as well as the predicted percentage of true positive calls derived from the λ value of the call set, is shown for each possible combination of sites.

