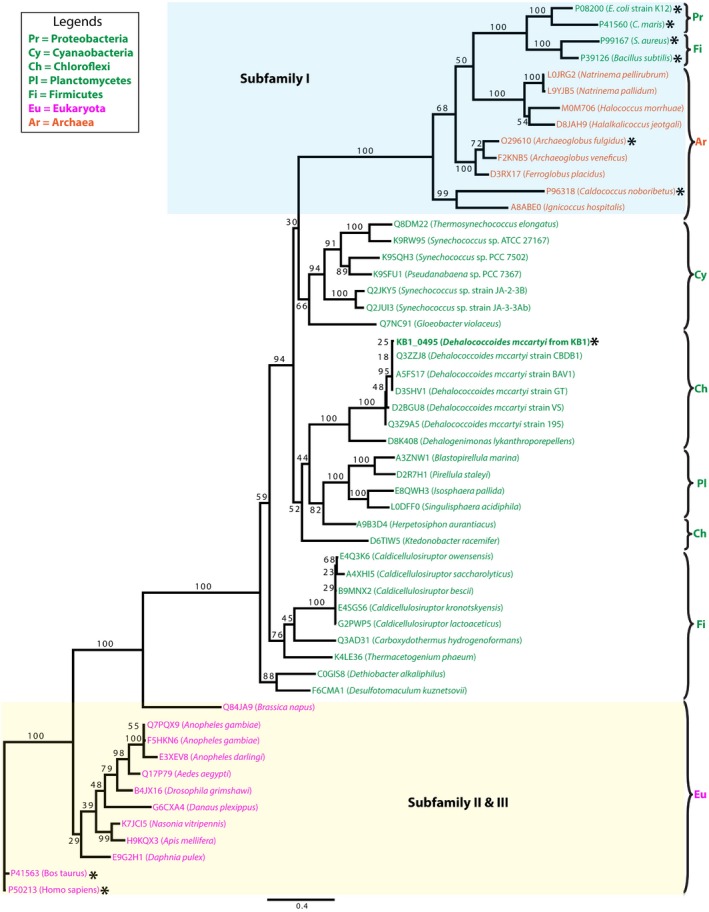
Figure 3.

Phylogenetic analysis of DmIDH protein sequence. Maximum likelihood (ML) tree for DmIDH and its homologous protein sequences was constructed by P hy ML (Guindon et al., 2010) plugin in geneious (Biomatters, 2011). Protein sequences were mined from UniProt (Apweiler et al., 2012) and aligned with muscle (Edgar, 2004) plugin in geneious. Then, the ML tree was constructed under wag (Whelan and Goldman, 2001) model of amino acid substitution with 100 bootstrap resampling trees were conducted. Bootstrap values are shown as branch labels, and the biochemically characterized genes are marked by asterisks. Organism names are coloured according to different kingdoms (Orange = Archaea, Green = Bacteria, and Purple = Eukarya).
