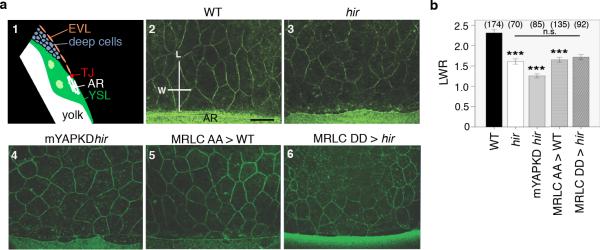
Extended Data Figure 3. Anisotropic EVL cell shape analysis in hir mutants.
a, 1, Schematic of sectional view of blastoderm margin of a gastrulating embryo (TJ, tight junction; AR actin ring; YSL, yolk syncytial layer; EVL, enveloping layer); 2-6, EVL shape was visualized in phalloidin-stained fixed medaka embryos at 75% epiboly (st.16, 21 hpf) and compared among, 2 WT (n=14); 3 hir (n=9); 4 maternal YAP KD hir mutants (mYAPKDhir,) by TB MO-injection into hir embryos (n=12), 5 MRLC-AA (dominant negative form) mRNA-injected WT (n=6); and 6, MRLC-DD (constitutive active form) mRNA-injected hir embryos (n=4). b, EVL shape anisotropy quantification by the length/width ratio (LWR, shown in a2) of marginal EVL cells (up to 4 rows back from the EVL/YSL boundary, shown in Fig. 2d bracket). While EVL shape anisotropy was reduced in hir mutant embryos (3) to a level comparable to that of MRLC blocked embryos (5), activation of MRLC in hir (6) did not rescue it. Parentheses indicate number of cells measured. Scale bar 30 μm. Error bars represent ± S.E.M. ***P < 0.001, one-way ANOVA (Extended Data Figure 3 source data).

