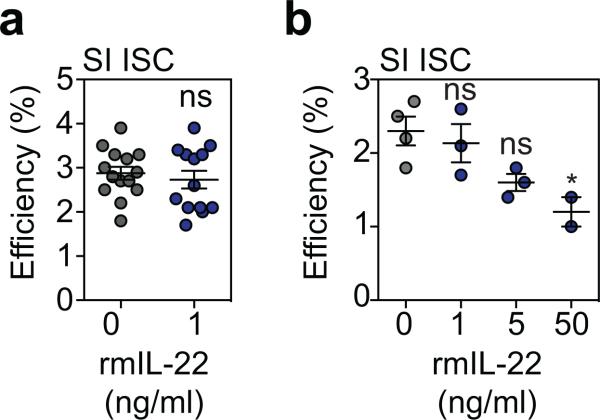
Extended Data Figure 3.
a-b Organoid efficiency as % of plated cells, in organoid cultures from sorted Lgr5+ ISCs from B6 Lgr5-GFP reporter mice using (a) a concentration of 1 ng/ml (n=14 wells/group combined from three experiments; t-test) and (b) with a concentration range (one experiment, n=3 wells/group; ANOVA). Graphs indicate mean +/− SEM; ns: non-significant; *p<0.05.

