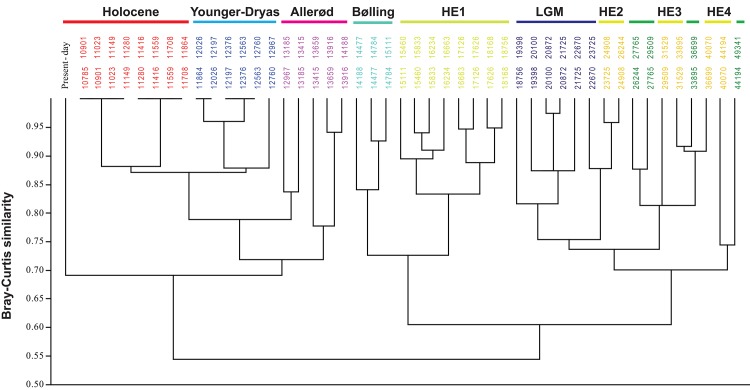
Fig 4. Cluster analysis based on Bray–Curtis dissimilarity and constrained by the succession of time-intervals.
Numbers correspond to the time-intervals. The different periods are distinguished by the colors used in Fig 5. The three green periods that are not named in the figure correspond to periods between Heinrich events 5 and 4, between Heinrich events 4 and 3, Heinrich events 3 and 2. See Fig 2 for abbreviations.

