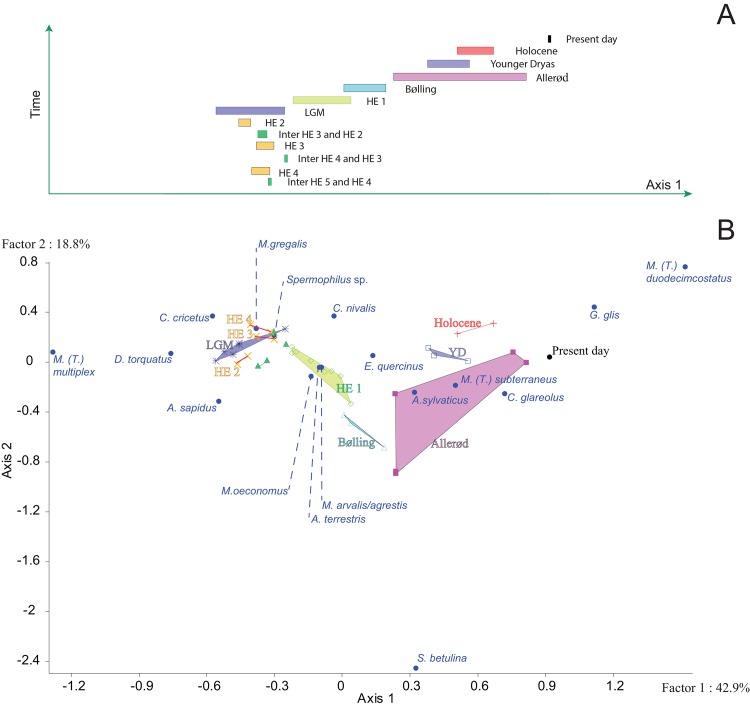
Fig 5. Correspondence analysis based on rodent associations defined for the species (circles) and each time-interval, gathered by following periods.
(▲): periods between Heinrich events 5 and 4; (x): Heinrich events 4 (40.2–38.3 ky BP); (▲): periods between Heinrich events 4 and 3 (38.3–32.7 ky BP); (x): Heinrich events 3 (32.7–29.0 ky BP); (▲): periods between Heinrich events 3 and 2 (29.0–26.0 ky BP); (x): Heinrich events 2 (26.0–24.0 ky BP); (*): Last Glacial Maximum (24.0–18.0 ky BP); (◊): Heinrich event 1 (18.0–14.7 ky BP); (Δ): Bølling (14.7–13.7 ky BP); (■): Allerød (13.7–12.9 ky BP); (□): Younger-Dryas (12.9–11.7 ky BP); (+): Holocene (11.7–10.9 ky BP). Time-intervals constituted by less than three stratigraphic units were excluded from the statistical analysis. See Fig 2 for abbreviations. A) Succession of periods obtained by time-intervals reported against Axis 1. B) Axis 1 reported against the Axis 2.

