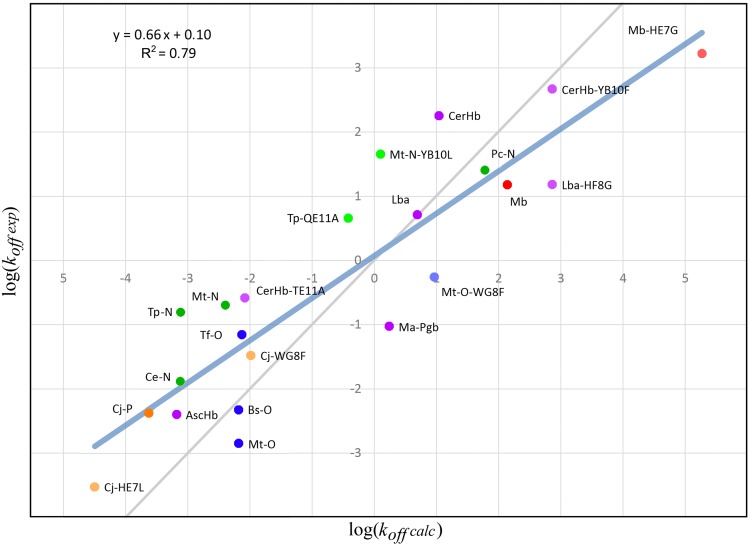
Fig 5. Plot of log(k off exp) vs log(k off calc).
Dots indicate Mb in red and the trHbs in green, blue and orange for groups N, O and P, respectively. Other globin forms are indicated in purple. Circles with lighter colors indicate mutant proteins. Identity line is shown in grey. A complete list of experimental and calculated values is available at S4 Table.

