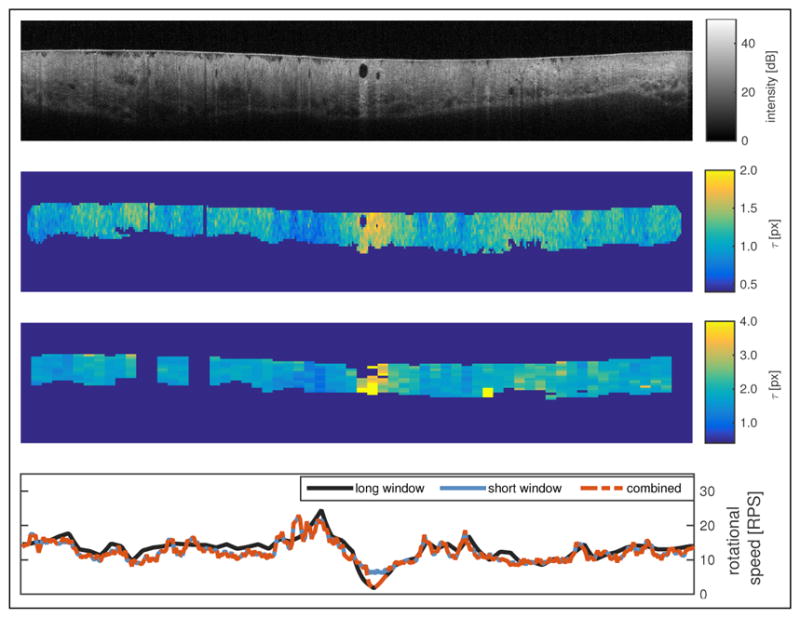
Fig. 1.

(top) Original tomogram, (top center) map of τ using the short window, (bottom center) map of τ using the long window, (bottom) rotational speeds as a function of azimuthal position for both windows and the combined result. See Visualization 1 for a series of 24 frames.
