Fig. 3.

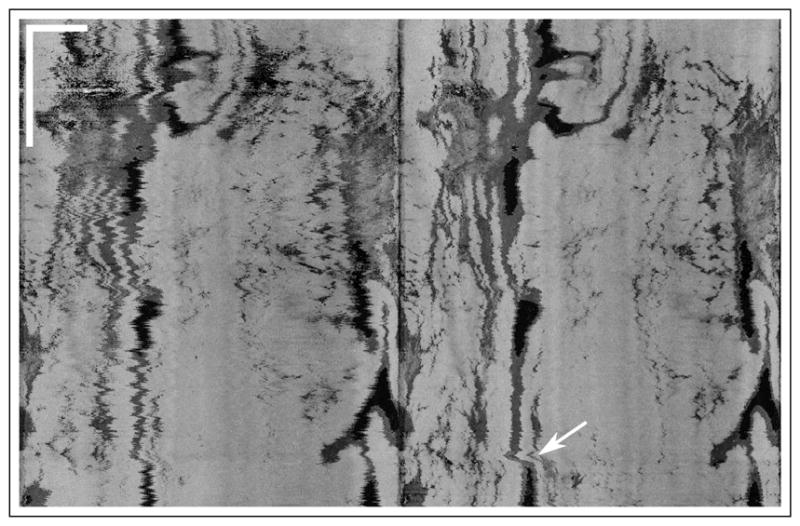
En face projection of (left) original tomogram and (right) NURD-corrected tomogram. The white arrow indicates patient motion. Scale bars at top left correspond to 10 mm in each direction. See Visualization 3 for a 24-frame fly through.

En face projection of (left) original tomogram and (right) NURD-corrected tomogram. The white arrow indicates patient motion. Scale bars at top left correspond to 10 mm in each direction. See Visualization 3 for a 24-frame fly through.