
Fig. 4.
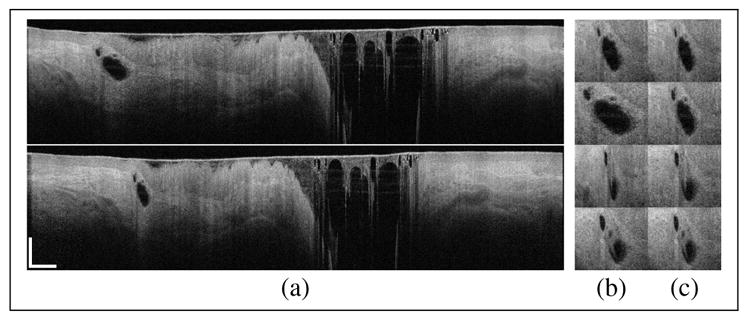
(a, top) Original and (a, bottom) NURD-corrected tomogram. The gland in (a) as seen in adjacent frames in the original (b) and NURD-corrected (c) data set. Scale bars correspond to 10 mm in azimuthal and 1 mm in axial directions. See Visualization 4 for a series of 24 frames.