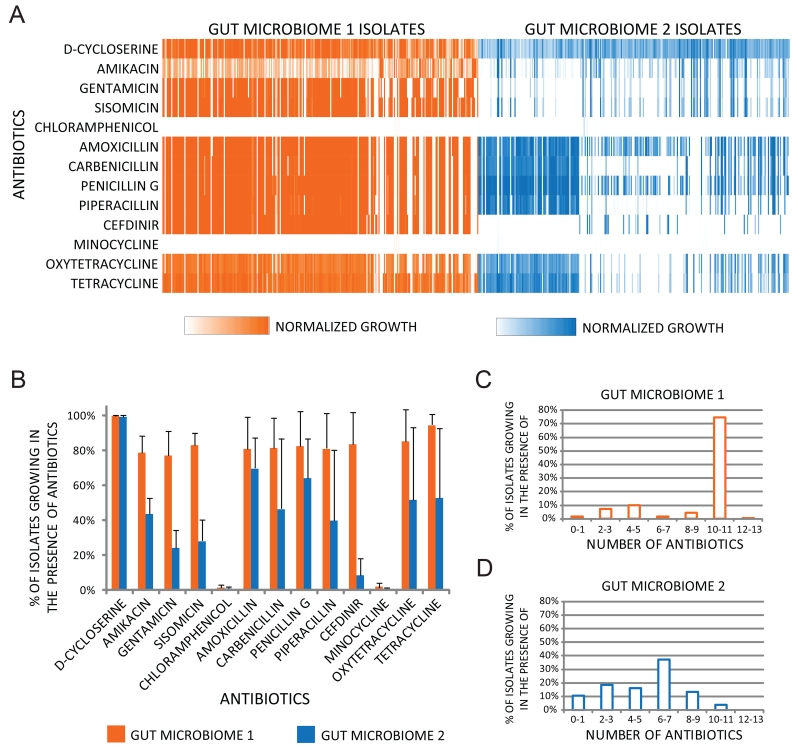
Figure 2.
Antibiotic resistance profiles of cultured aerobic gut microbiome isolates. (A) Heat map displaying resistance profiles of 572 aerobic bacterial isolates obtained across 3 different sampling times from two human gut microbiomes. 7436 growth measurements of aerobic cultured microbiome isolates after 24 hrs at 37 °C in Luria Broth containing one of 13 antibiotics at concentrations between 20 and 100 mg/mL that prevent the growth of wild type E.coli (Table S1) are displayed as linear color-scaled bars. White denotes no growth, and color intensity is proportional to growth in the presence of antibiotic, scaled to growth in the absence of antibiotic per individual isolate. (B) Percentage of aerobic gut isolates resistant to each of 13 antibiotics. Each data point represents the mean number of isolates resistant to each antibiotic, and error bars represent the standard deviation of this mean value from each of the three sampling times. Histogram depicting the distribution of the number of different antibiotics that aerobic (C) gut microbiome 1 and (D) gut microbiome 2 isolates are resistant to.

