
Figure 1. Transcriptional drift-variance increases with age.
(a) Schematic of RNA-seq experiment. In cohort #1, water or mianserin was added on day 1 of adulthood and RNA samples were harvested on day 1 (water only), day 3 (d3), day 5 (d5) and day 10 (d10). In cohort #2, animals were treated with water or increasing concentrations of mianserin (2, 10 or 50 µM) on day 1 (d1) and RNA was harvested on day 5 (d5) for RNA-seq. In cohort #3, water or 50 µM mianserin was added on day 1, day 3, and day 5, and RNA was harvested on day 10 (d10) for RNA-seq. (b) Venn diagrams of the number of GOs enriched for genes that decrease expression with mianserin (down, dark blue circle) increase expression with mianserin (up, light blue circle) or are enriched for both (intersection). (c) Venn diagrams of the number of GOs enriched for genes that decrease expression with age (down, gray circle) increase expression with age (up, white circle) or are enriched for both (intersection). (d) Heat map depicting log2 changes in gene expression for oxidative stress genes elicited by increasing concentrations of mianserin (yellow, increased expression; blue, decreased expression) (e) Mianserin decreases expression of redox genes that increase with age and increases expression of genes that decrease with age. (f) Mianserin reverts age-associated changes on the level of GOs. Venn diagrams of the number of GOs enriched for genes that decrease expression with mianserin (down, dark blue circle) and increase with age (up, white circle) or vice versa (down with age, gray circle; up with mianserin, light blue circle). (g) Mianserin reverts age-associated changes on the level of individual genes. Volcano plot shows the negative log10 of P-values as a function of log2 fold changes of 3,367 genes that significantly change expression from day 1 to day 3 in samples of water-treated control animals (black) or samples from age-matched mianserin-treated animals (50 µM, blue). As animals age, gene expression levels change (“drift”) away from levels observed in young adults (yellow line). Mianserin treatment attenuates age-associated gene expression changes preserving expression levels as seen in young adults. (h) Drift-plot shows log fold change (old/young) as a function of age for each gene involved in oxidative phosphorylation (gray lines. KEGG: cel 04142). Superimposed are Tukey-style box-plots to graph the increases in drift-variance across the entire pathway. Gene expression changes are classified into type I, which describes activation or repression of the entire pathway and into type II, which describes changes among genes relative to each other (drift-variances), see red arrows. (i) Drift-plot for lysosomal genes (KEGG: cel 00190). See Figure 1—source data 1–5, Figure 1—figure supplement 1 and Table 1 for additional information on data-sets. Also see Methods section for transcriptional drift calculation in each figure panel.
DOI: http://dx.doi.org/10.7554/eLife.08833.003
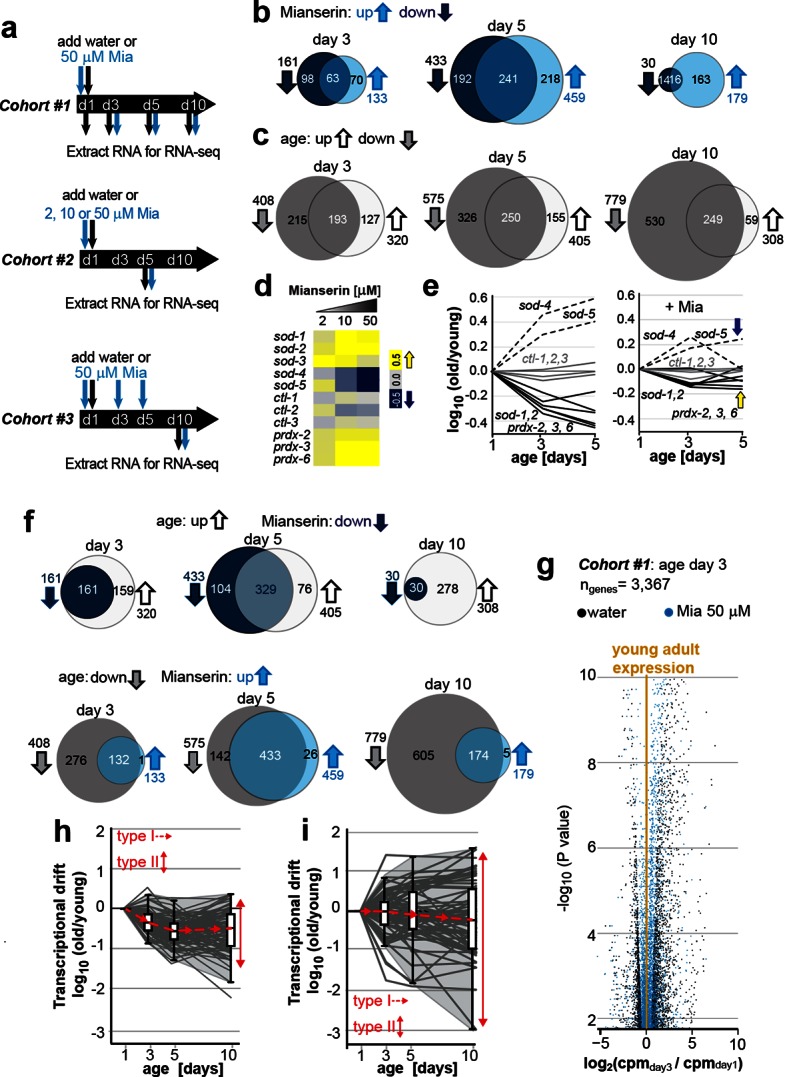
Figure 1—figure supplement 1. This figure relates to Figure 1 in main text.
