
Figure 4. Hydrophobic and Electrostatic Interactions in a Snf7 Filament.
(A–B) Ribbon models of a Snf7 protofilament. The hydrophobic protein interface is shown in black dash-line and the electrostatic interface in grey dash-dot line. (C–D) Close-up views of the hydrophobic interface between α2/3i and α3i+1 and the electrostatic interface between α1i and α2/3i+1. Protomer (i) shown in yellow and protomer (i+1) in red. (E) Conceptual model for the Mup1-pHluorin MVB sorting assay. Vacuole (v). (F) Quantitative MVB sorting data for snf7Δ yeast exogenously expressing empty vector, SNF7, snf7L121D, snf7I117E, snf7M114E, snf7M107E, snf7T103E, snf7L99K, snf7M104E, snf7L101E, snf7A97K, snf7I94E, snf7Q90K, snf7M87E, and snf7T83E. Error bars represent standard deviations. (G) Quantitative MVB sorting data for snf7Δ yeast exogenously expressing empty vectors, SNF7, snf7R25E H29E K36Eand empty vector, empty vector and snf7E95K E102K E109K, and snf7R25E H29E K36E and snf7E95K E102K E109K. Error bars represent standard deviations. (H) Representative TEM images of recombinant full-length Snf7R52E, Snf7R52E Q90K, Snf7R52E M107E, Snf7R52E R25E H29E K36E, Snf7R52E E95K E102K E109K, and Snf7R52E R25E H29E K36E and Snf7R52E E95K E102K E109K (1:1). Scale bars, 200 nm.

Figure 4—figure supplement 1. Hydrophobic Interface Mutant Analysis.

Figure 4—figure supplement 2. Western blotting analyses of snf7Δ yeast expressing SNF7, snf7L121D, snf7I117E, snf7M114E, snf7M107E, snf7T103E, and snf7L99K, and SNF7, snf7M104E, snf7L101E, snf7A97K, snf7I94E, snf7Q90K, snf7M87E, and snf7T83E.

Figure 4—figure supplement 3. Quantitative MVB sorting data for snf7Δ yeast exogenously expressing empty vector, SNF7, snf7R25E, snf7H29E, snf7K36E, snf7E95K, snf7E102K, and snf7E109K, and empty vector, SNF7, snf7R25E K36Eand vector, vector and snf7E95K E109K, snf7R25E K36Eand snf7E95K E109K.

Figure 4—figure supplement 4. Western blotting analyses of snf7Δ yeast expressing SNF7, snf7R25E H29E K36E, and snf7E95K E102K E109K.
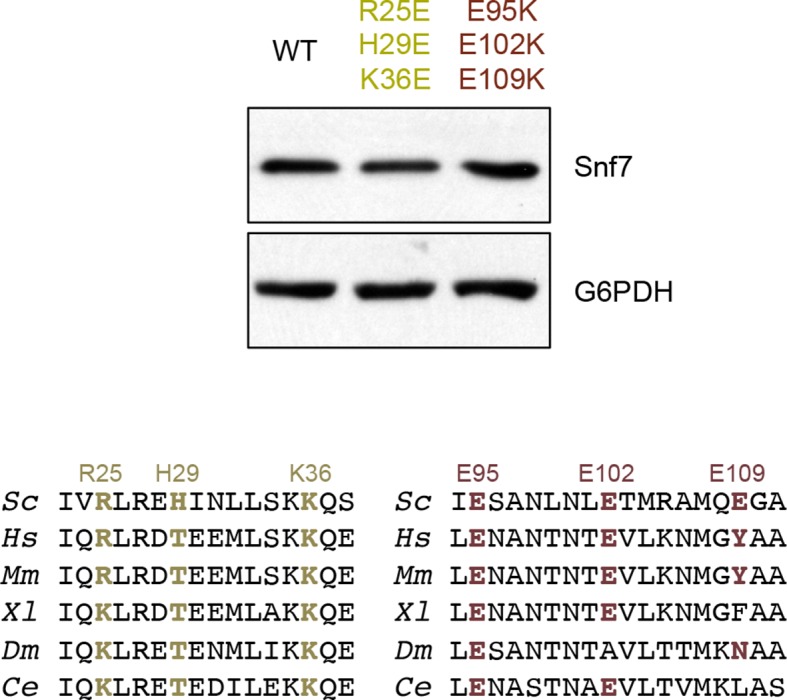
Figure 4—figure supplement 5. Western blotting analyses of ex vivo P13 fractions BMOE crosslinking by Snf7K35C with Snf7K60C, Snf7A63C, Snf7K69C, Snf7Q75C, Snf7E81C, Snf7E88C, Snf7E95C, and Snf7E102C.
