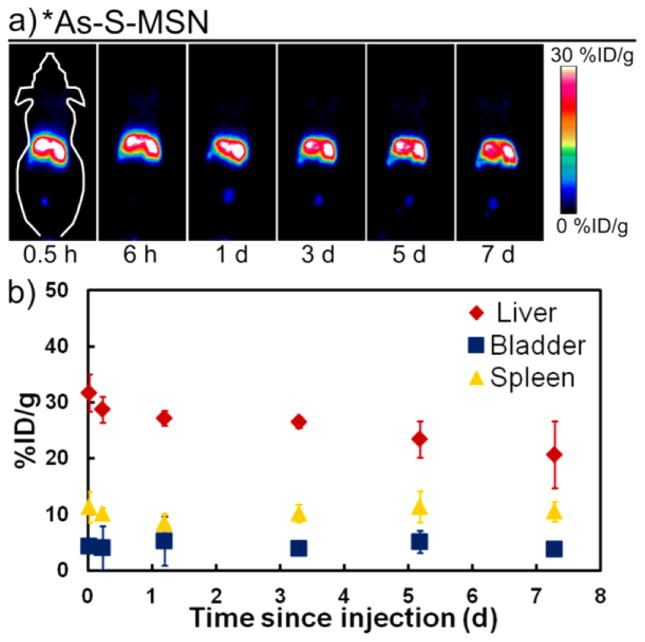
Figure 6.
(a) Representative serial PET maximum intensity projection images taken at six times following the injection of *As–S-MSN. (b) PET-quantified percent injected dose per gram (%ID/g) for regions of interests around the liver (red diamonds), bladder (blue squares), and spleen (yellow triangles) as a function of time since injection of *AsS-MSN.

