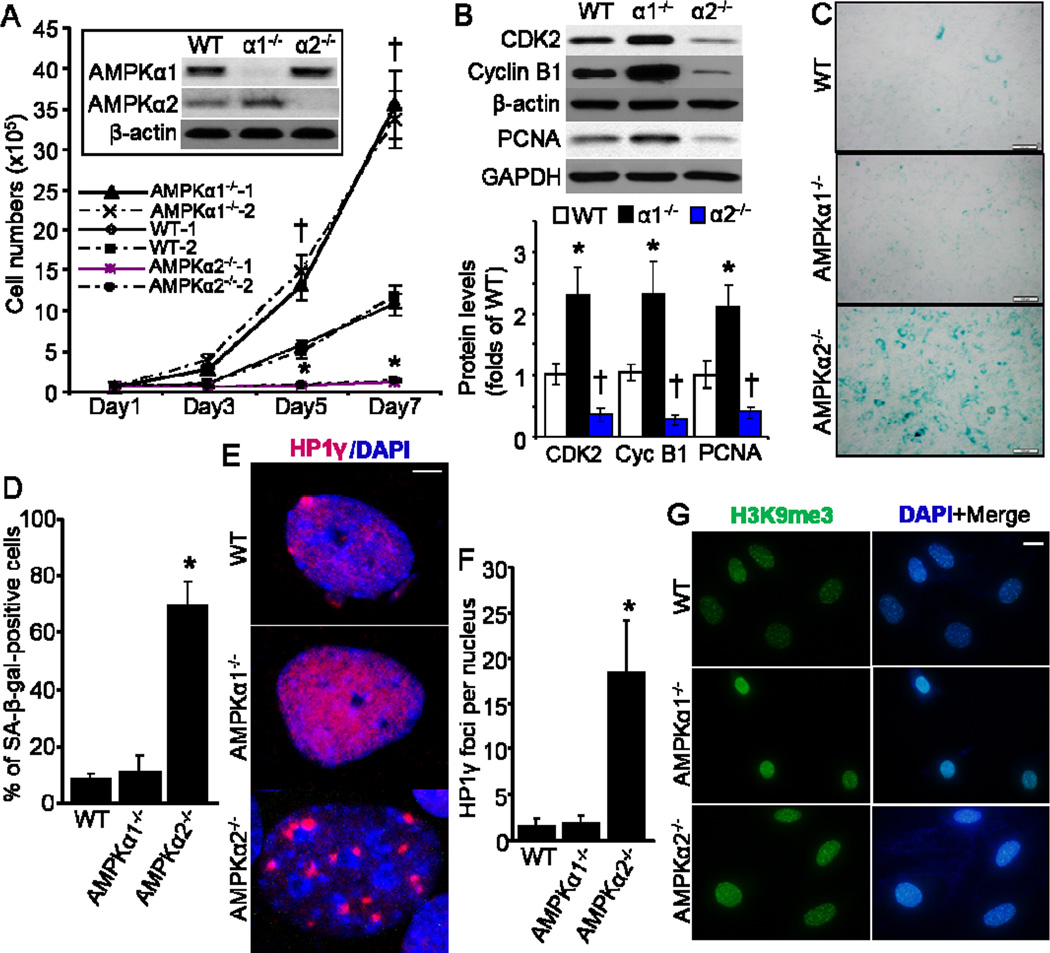
Fig. 1.
Deficiency of AMPKα2, but not AMPKα1, leads to enhanced cellular senescence in MEFs. (A) Wild type (WT), AMPKα1−/− and AMPKα2−/− MEFs (two independent cell lines for each) were seeded with 0.5 × 10⁵ cells in 6-well plates. Cell number counting was taken at different time point. n=8, *p< 0.05 vs WT, †p< 0.01 vs WT. Representative Western blot of AMPKα1 and AMPKα2 was shown as an inset of bar graph. (B) Profile of cellular proliferation-associated proteins, including CDK2, Cyclin B1, and PCNA. n=6, *p< 0.01 vs WT, †p< 0.01 vs WT. (C) Representative images showing SA-β-galactosidase (SA-β-gal) activity in WT, AMPKα1−/−, and AMPKα2−/− MEFs. Scale bar = 50 μm. (D) Percentage of SA-β-gal-positive cells in cultured MEFs. n=10, *p< 0.05 vs WT. (E) HP1γ foci formation was increased in AMPKα2−/− MEFs. Representative images showing HP1γ foci formation (red color), marking senescence. Scale bar = 2.5 μm. (F) Quantitative analysis of HP1γ foci per nucleus. n=20, *p< 0.01 vs WT. (G) Representative images showing staining of anti-H3k9me3. Scale bar = 20 μm.

