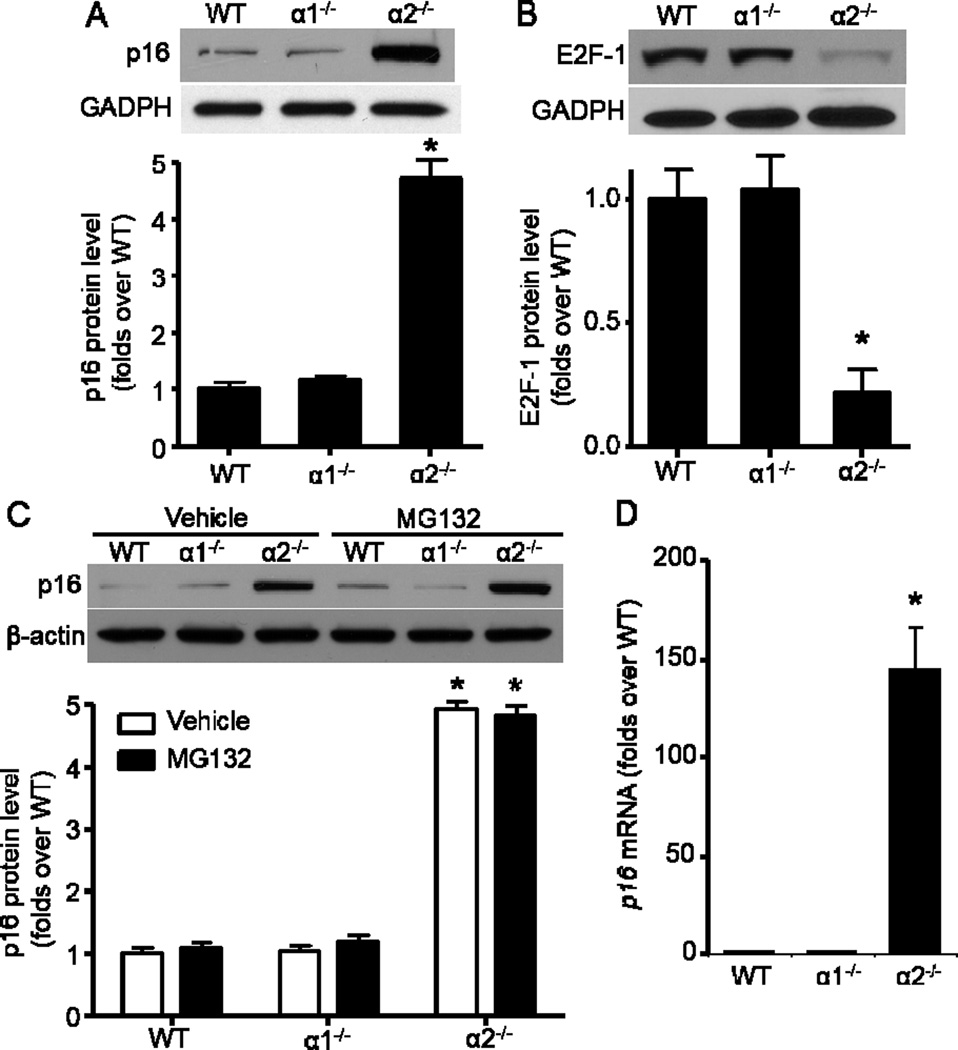
Fig. 2.
Transcriptional upregulation of p16 in AMPKα2−/− MEFs. (A) (Upper) AMPKα2 deletion significantly upregulated p16. (Bottom) Quantification of Western blot data. n=8, *p< 0.001 vs WT. (B) (Upper) AMPKα2 deletion significantly down-regulated E2F1. (Bottom) Quantification of Western blot data. n=6, *p< 0.001 vs WT. (C) Proteasome inhibitor, MG132 (20 μM, 8 h) did not further increase p16 in AMPKα2−/− MEFs. n=4, *p< 0.001 vs WT. (D) Quantitative RT-PCR analysis of p16 expression in MEFs. β-actin was used as endogenous loading control. Values are mean ± SEM of four independent experiments, *p< 0.001 vs WT.

