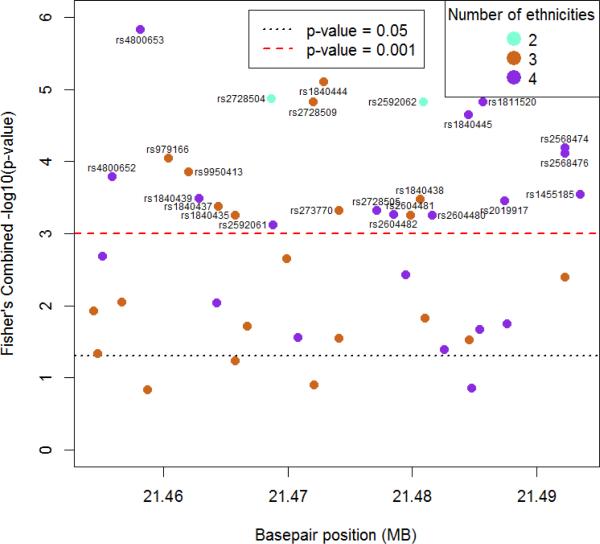
Figure 1.
Fisher's combined –log10(p-value) for each SNP × environment (neighborhood index score) interaction in region 46 plotted against genomic position
SNPs with Fisher's combined p-value < 0.001 are identified by rs number. Colors indicate the number of ethnicities that were used in calculating the Fisher's combined p-value. Only SNPs with race/ethnicity-specific minor allele frequency > 5% were included in the Fisher's combined analysis.

