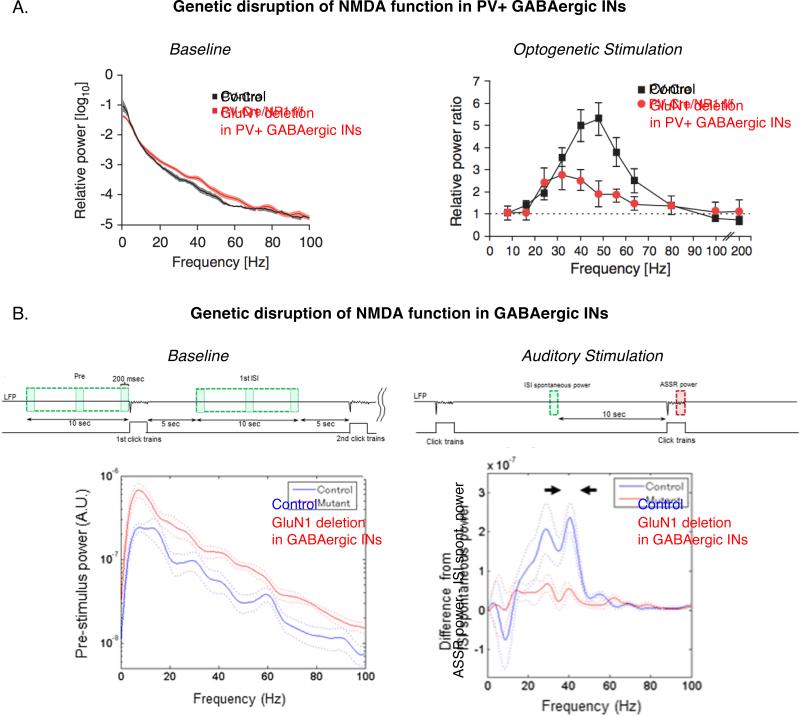
Figure 2. GBO alteration in genetic NMDAR hypofunction models of SZ.
(A) Power in different frequency bands in the EEG signal recorded from anaesthetized control mice (black) and those with deletion of GluN1 subunit of NMDARs in PV+ GABAergic neurons (red). Left: Baseline, Right: Stimulus-processing state (Adapted from (61))
(B) Power difference in different frequency bands in the EEG signal recorded from control mice (blue) and those with deletion of GluN1 subunit of NMDARs targeting all GABAergic neurons (red). Left: Baseline, Right: Stimulus-processing state (Adapted from (63))

