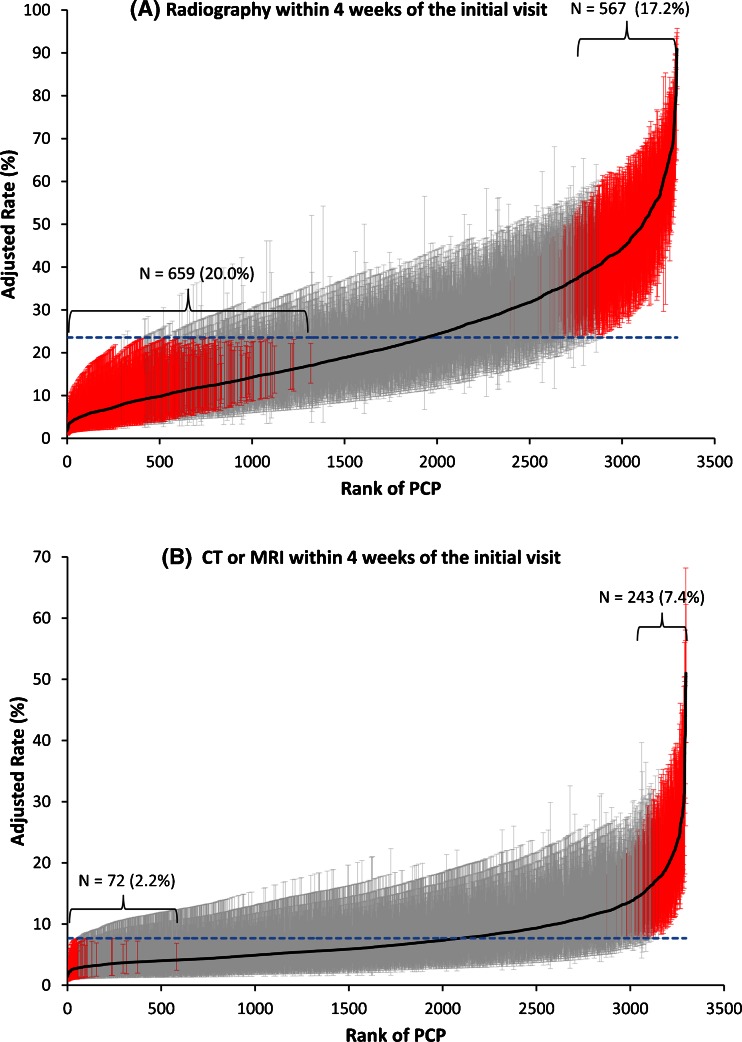
Figure 1.
Variation among 3297 primary care physicians (PCPs) in rates of imaging use within 4 weeks of an initial visit for non-specific acute low back pain. Adjusted rates (solid black line) and 95 % confidence intervals (vertical lines around the solid black line) for each PCP are shown. Estimates were adjusted for patient characteristics and clustering of patients within physicians using multilevel logistic regression modeling. PCPs were ranked from 1 to 3297 (horizontal axis) according to their adjusted rates of imaging use (vertical axis), with a rank of 1 indicating lowest use and 3297 indicating highest use. Outlier PCPs with adjusted rates significantly different from the average rate (horizontal blue dashed line) are indicated in red.

