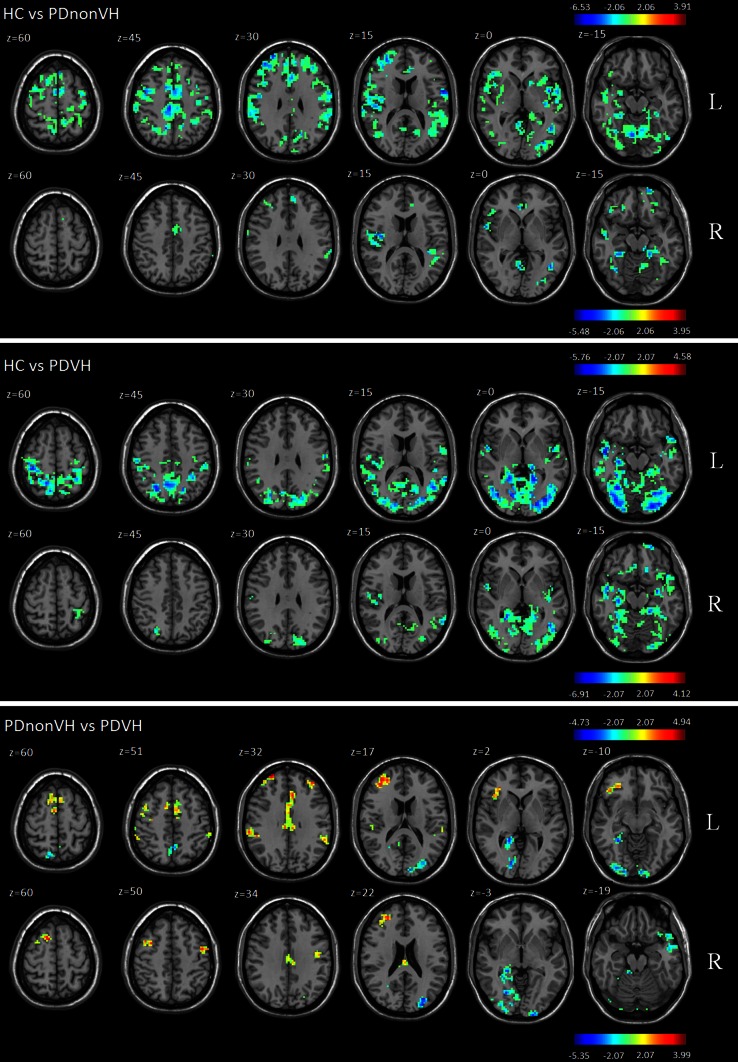
Fig. 2.
Group differences in hippocampal functional connectivity. Statistical results are superimposed on the standard Montreal Neurological Institute template (x coordinates are reported) (mm) at the given threshold corrected for multiple comparisons [Monte-Carlo Simulation, cluster size = 1,701 mm3 (63 voxels), in comparison between HC and PDnonVH, T > 2.06 (or T < −2.06) in comparison between HC and PDVH, and in comparison between PDnonVH and PDVH, T > 2.07 (or T < −2.07)]. Age and MMSE scores are entered as covariables. In each panel, blue indicates relatively lower functional connectivity in the second group compared to the first; red indicates the reverse. The right side of the figure is the left side of the brain. L functional connectivity with left hippocampus, R functional connectivity with the right hippocampus

