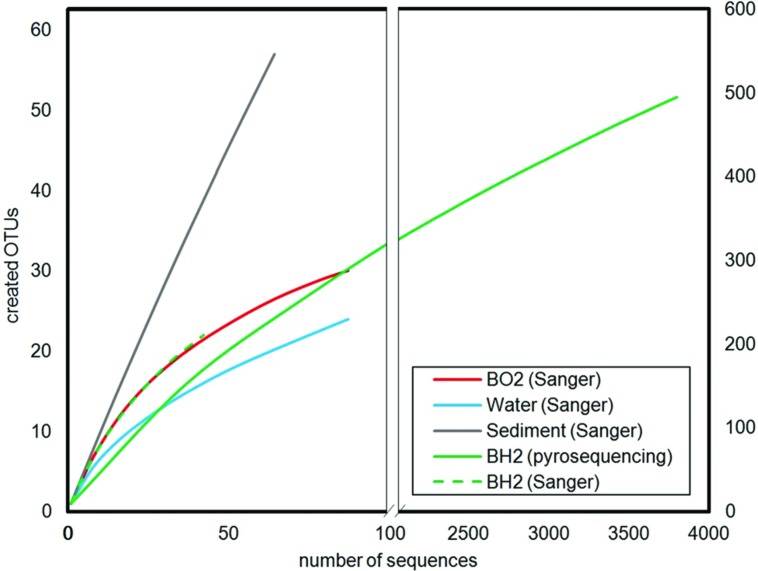
FIGURE 2.
Rarefaction curves calculated for a 0.03 distance level. The left part corresponds to an enlarged view of the number of OTUs created for a number of analyzed sequences below 100 in order to allow the comparison between the low number of sequences obtained by Sanger sequencing for seawater, sediment and basaltic glasses, and the high number of sequences obtained by 454-pyrosequencing for the reduced basaltic glass.

