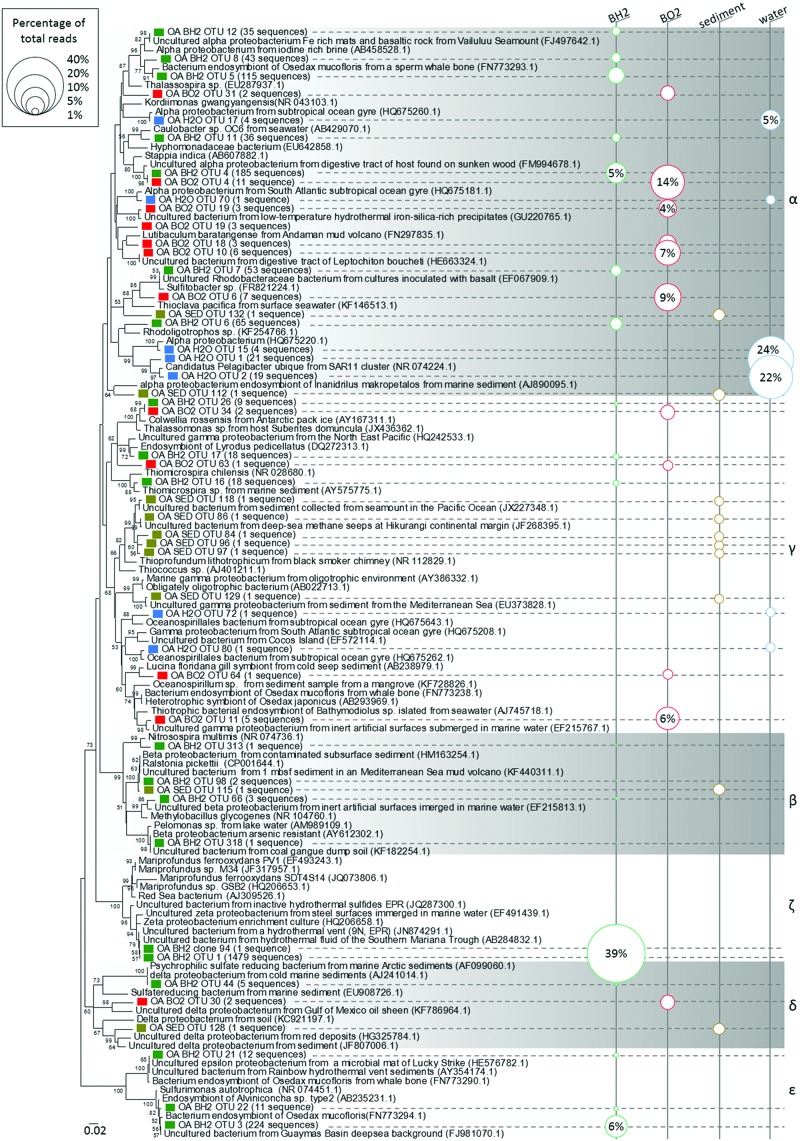
FIGURE 3.
Phylogenetic relationships among the proteobacterial 16S rRNA gene sequences of representative OTUs of the oxidized (BO2) and reduced (BH2) basaltic glass incubated in the abyssal plain along with the seawater (H2O) and the sediment (SED). Sequences obtained in this study and designated by a prefix “OA” are indicated by a colored square; Green = BH2; Red = BO2; Blue = H2O; Bright brown = SED. The corresponding number of sequences obtained for each OTU is indicated after the name of the representative and the size of the circles in the right part figures the percentage represented by each OTU with respect to the total number of sequences. The numbers in the parentheses are the GenBank accession numbers for the NCBI sequences. The tree was determined by neighbor-joining analysis. Bootstrap values for nodes were obtained using 1,000 replicates, and only values >50% are indicated. The scale bar represents 0.02 substitutions per nucleotide position. α, γ, β, ζ, δ, and ε stand for Alphaproteobacteria, Gammaproteobacteria, Betaproteobacteria, Zetaproteobacteria, Deltaproteobacteria, and Epsilonproteobacteria, respectively.

