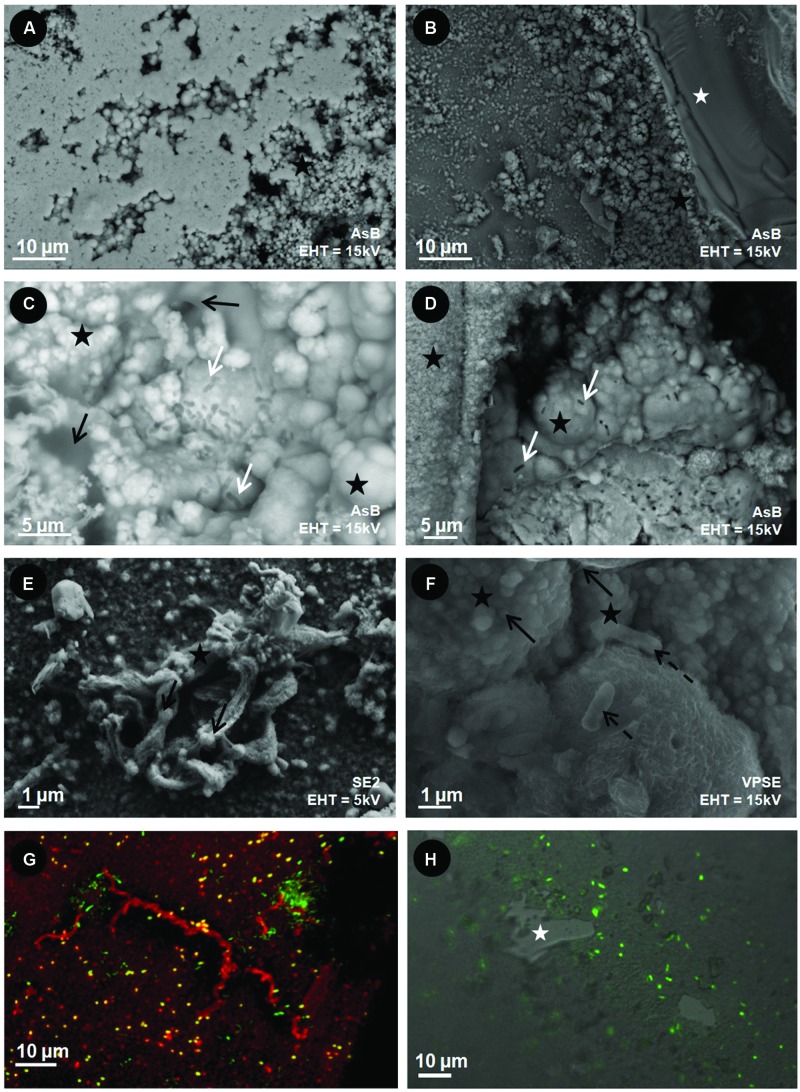
FIGURE 5.
Scanning Electron Microscopy (A–F) and CLSM (G,H) images of the surface of the reduced basaltic glass (BH2) incubated in vitro with M. ferrooxydans DIS-1 (left) and in situ in the abyssal plain (right). White stars = basaltic glass surface; black stars = iron oxides; black dotted arrows = cell-like structures; white arrow = cell imprints; black arrows = organic matter. (G) Composite CLSM image obtained with a sequential excitation at 488 and 555 nm and fluorescence emission collected between 300–550 and 578–800 nm, respectively; Green = SYTO®13 (DNA dye); Red = rhodamine-conjugated Ricinus communis agglutinin I (aliphatic chains’ marker); (H) CLSM image obtained with a excitation at a wavelength of 488 nm, by collecting the emitted fluorescence between 300 and 500 nm surperimposed on an image obtained in Differential Interferential Contrast; Green = SYTO®9 (DNA marker). Accelerating voltage (EHT) and detection modes (SE2, V PSE, Inlens = secondary electrons; AsB = backscattered electrons) used for each image are indicated.

