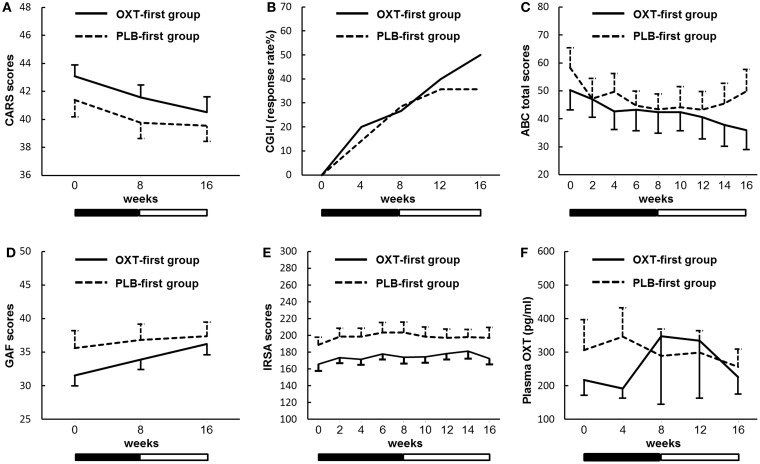
Figure 3.
Sequential changes in the outcome measures. (A) The Childhood Autism Rating Scale (CARS). (B) The Clinical Global Impressions – Improvement scale (CGI-I). (C) The Aberrant Behavior Checklist (ABC). (D) The Global Assessment of Functioning (GAF). (E) The Interaction Rating Scale Advanced (IRSA). (F) Plasma oxytocin (OXT) concentrations. Solid and dashed lines indicate the OXT-first and placebo (PLB)-first groups. Black and white bars indicate the first treatment period and second treatment period, respectively (8 weeks for each period). Error bars indicate the SEM values. Response rates in the CGI-I show the percentages of participants assessed at 1 (very much improved) or 2 (much improved). There were no significant main effects of the treatment on any of the outcome measures.

