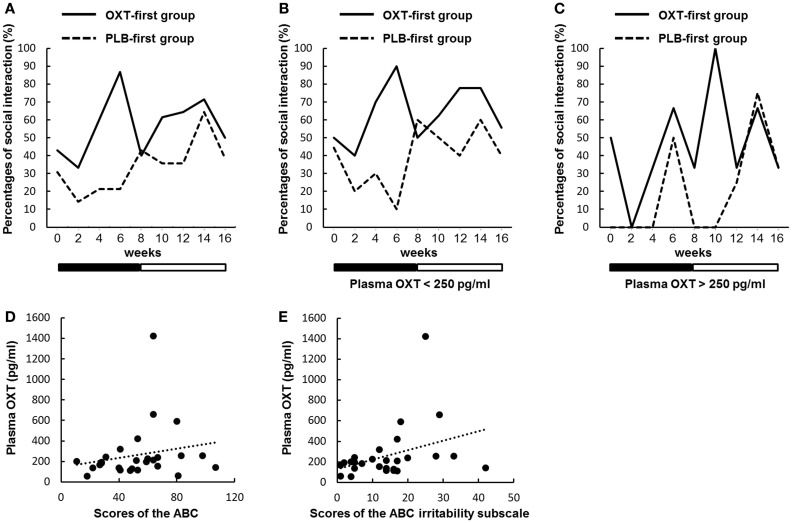
Figure 4.
Sequential changes in the percentages of participants with at least one episode of social interaction. (A–C) Percentages indicate the proportions of all participants who had at least one episode that was regarded as reciprocal social interactions every 2 weeks. Solid and dashed lines indicate the oxytocin (OXT)-first and the placebo (PLB)-first groups. Black and white bars indicate the first treatment period and second treatment period, respectively. (A) There were significant main effects for time and order, but not for treatment (P = 0.090). However, during the first treatment period, there was a significant main effect of treatment (P = 0.029). Moreover, there was a significant interaction between treatment and time (P = 0.041). (B) Sequential changes of episodes regarded as reciprocal social interactions in participants (n = 20) with plasma OXT concentrations below 250 pg/ml. There were significant main effects for time and order, but not for treatment (P = 0.109). However, during the first treatment period, there was a significant main effect of treatment (P = 0.028). Moreover, there was a significant interaction between treatment and time (P = 0.038). (C) The same as in B, except participants (n = 7) with OXT concentrations over 250 pg/ml. A generalized mixed regression analysis not including ID showed no significant main effect of treatment (P = 0.983) during the first treatment period. (D,E) Scatter plots portraying the relationships between plasma OXT concentrations and baseline scores on the Aberrant Behavior Checklist (ABC) (D) and the ABC irritability subscale (E). The slopes of the dotted linear regression lines indicate a correlation trend [P = 0.079 (D)] and a significant correlation [P = 0.020 (E)] in all of the participants.

