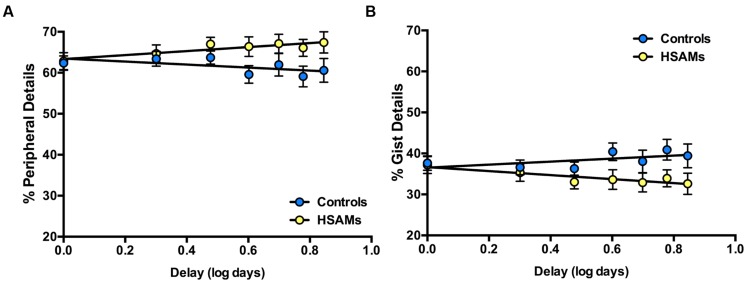
FIGURE 4.
Percentage of autobiographical peripheral and gist details recalled over past 7 days. Log transformation of linear regression representing percentage of autobiographical peripheral and gist details recalled over the past 7 days. HSAM participants (n = 28, yellow circles); Controls (n = 29, blue circles). (A) HSAM participants’ recollections maintain a greater percentage of peripheral detail over time. (B) Control participants’ recollections maintain a greater percentage of gist detail over time. Slopes are significantly different from one another for graphs A and B (p = 0.046). Graph (A) is (and must be) a mirror image of (B). All values are means ± SEM

