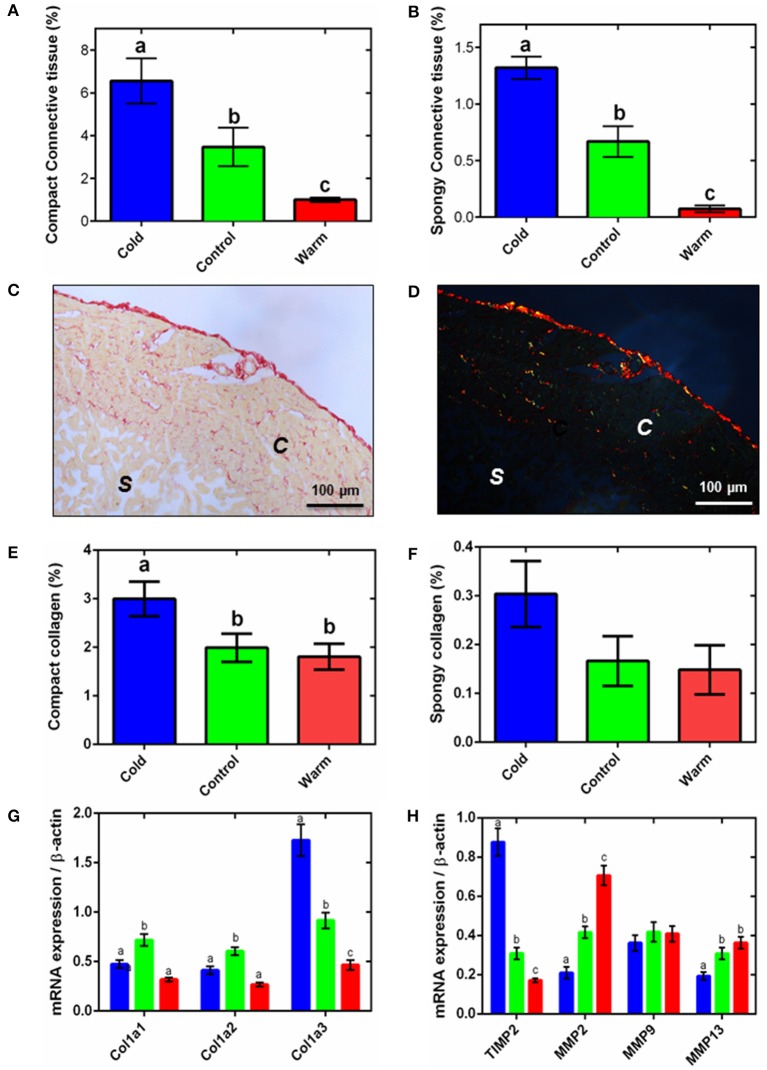
Figure 2.
Ventricular connective tissue remodeling. Semi-quantification of amorphous collagen from Masson's trichrome histology for compact tissue (A) and spongy tissue (B). Representative (C) bright-field and (D) polarized micrographs of sections of ventricular tissue stained with picro-sirus red, showing the spongy (s) and compact (c) myocardium. Semi-quantitative analysis of picro-sirus red stained sections (E) compact and (F) the spongy myocardium. In (A,B,E,F), collagen content is expressed as a percentage of total tissue for either the compact or spongy layer. The corresponding mRNA expression of (G) collagen genes and (H) collagen regulatory genes (TIMP2, up-regulation; MMP2, MMP9, and MMP13, down-regulation) in the spongy myocardium of cold (5°C; blue), control (10°C; green), and warm (18°C; red) acclimated rainbow trout (n = 7 fish for each acclimation group; 3 replicates for each animal were averaged for both histology and qPCR). Values presented are mean ± S. E. Significance was assessed by GLM with a Tukey, or Holm-Sidak for multiple comparisons, post-hoc test. Significance between groups is shown by dissimilar letters (P < 0.05).

