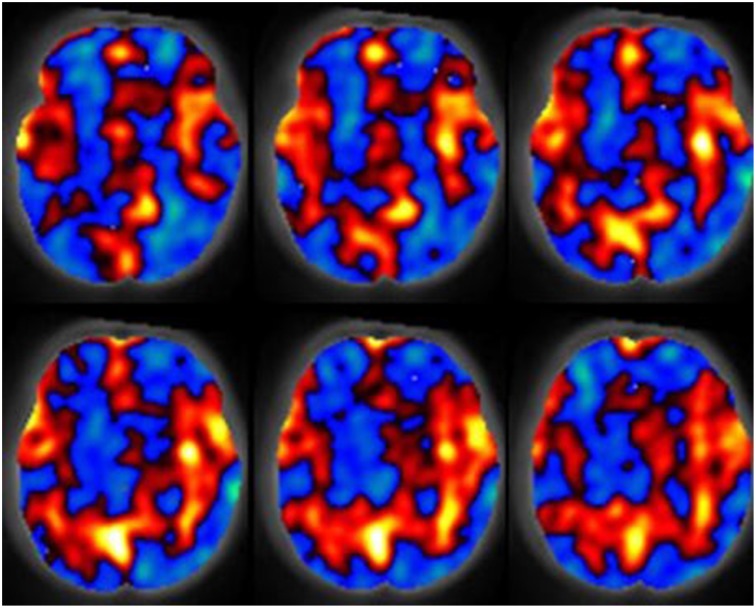
Figure 1.
The spatial relative cerebral blood flow discrepancy map comparing groups of subjects 7 and 13 months old. Red values indicate greater blood flow in the 13 month group, blue values indicate greater blood flow in the 7 month group. Results were computed with a support vector machine. Figure is reproduced with permission (Wang et al., 2008).

