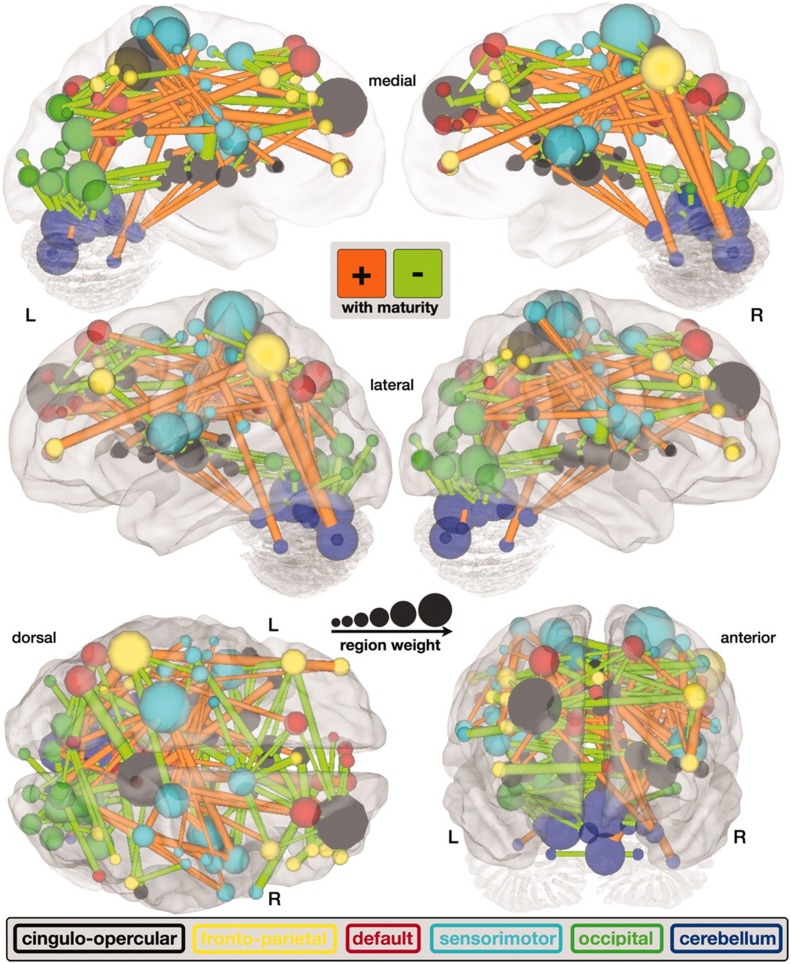
Figure 3.
A map of functional connectivity in the brain computed with the support vector machine. Connections positively correlated with age are shown in orange. Negative correlations with age are shown in light green (Dosenbach et al., 2010). Figure is reproduced with permission.

